Mastering Trade Entries and Exits with thinkorswim Indicators in 2024

Successful trading is a delicate balance of skill, strategy, and timing. One of the key elements in achieving profitability in the market is mastering the art of entering and exiting positions at the right time. thinkorswim, a powerful trading platform by TD Ameritrade (now the platform is owned by Charles Schwab), provides traders with a comprehensive suite of indicators that can significantly enhance decision-making processes. In this blog post, we’ll explore how thinkorswim indicators can be invaluable tools for traders aiming to optimize their entry and exit points.

Understanding Market Trends

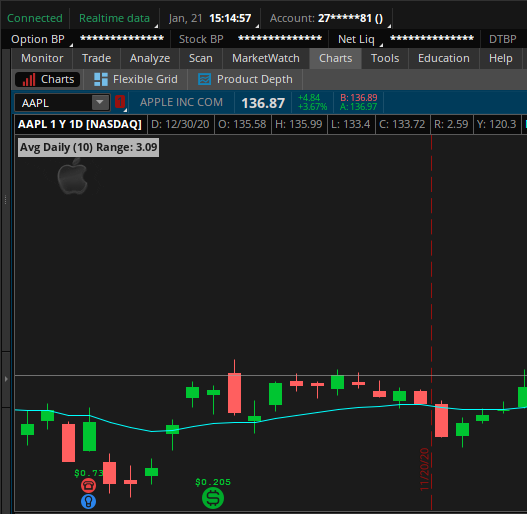
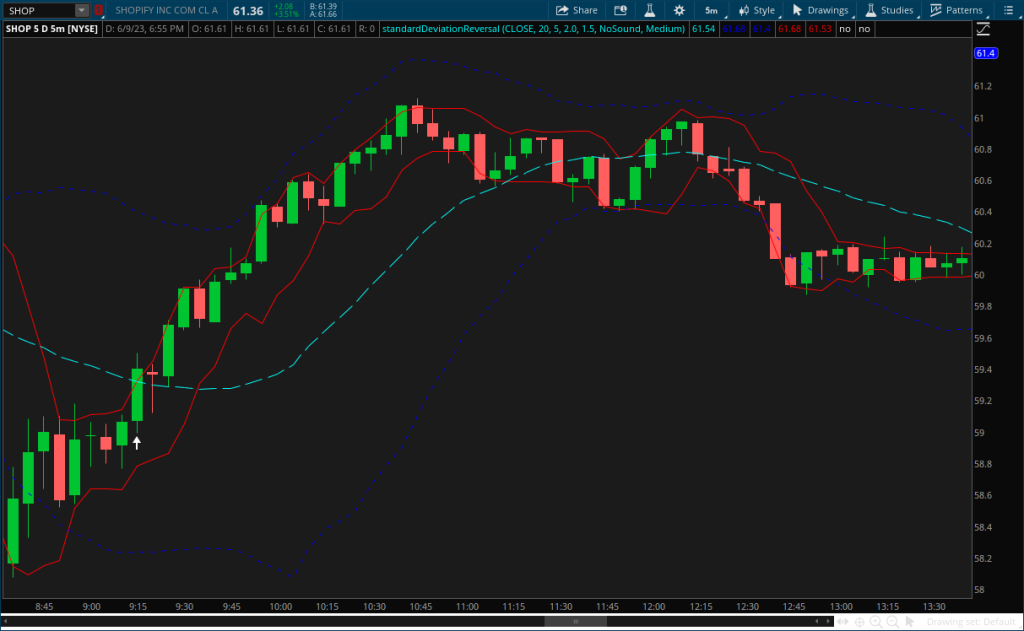
Before executing any trade, it’s crucial to identify the prevailing market trend. thinkorswim offers a variety of trend indicators such as Moving Averages, Bollinger Bands, and the Average True Range (ATR). These indicators help traders analyze the direction and strength of the market, aiding them in making informed decisions on when to enter or exit a position.

  • Moving Averages (MA): Moving averages, available in various forms (simple, exponential, weighted), smooth out price data to create a trend-following indicator. Traders use MAs to identify the direction of the trend. Crossovers between short-term and long-term MAs can signal potential trend reversals or continuations.
  • Bollinger Bands: These consist of a middle band being an MA and two outer bands representing standard deviations. Bollinger Bands help traders identify overbought or oversold conditions and potential price reversals when the price touches or exceeds the outer bands.
  • Average True Range (ATR): ATR measures market volatility, providing insights into potential price movements. Traders can use ATR to set stop-loss and take-profit levels based on the current market conditions.

Timing Entry Points

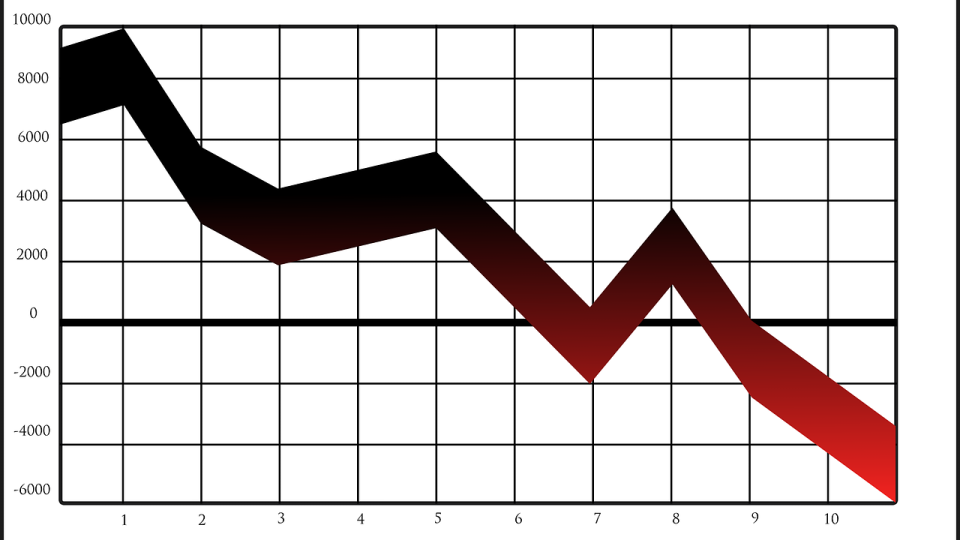
The Relative Strength Index (RSI) and the Moving Average Convergence Divergence (MACD) are powerful tools for timing entry points. RSI indicates overbought or oversold conditions, signaling potential reversal points. MACD, on the other hand, provides insights into the momentum of a trend, helping traders identify optimal entry opportunities.

  • Relative Strength Index (RSI): RSI measures the speed and change of price movements. An RSI above 70 suggests overbought conditions, indicating a potential reversal, while an RSI below 30 suggests oversold conditions, signaling a possible buying opportunity.
  • Moving Average Convergence Divergence (MACD): MACD consists of two lines – the MACD line and the signal line. Crossovers between these lines provide buy or sell signals. Additionally, MACD histogram bars indicate the strength of the trend.

Setting Stop-Loss and Take-Profit Levels

Managing risk is a crucial aspect of successful trading. thinkorswim’s ATR indicator can be immensely helpful in setting appropriate stop-loss and take-profit levels. By understanding the average volatility of a security, traders can establish realistic expectations and mitigate potential losses by placing stops at strategic levels.

ATR can help traders set dynamic stop-loss levels by considering the current volatility. For example, a trader may set a stop-loss at 1.5 times the ATR below the entry price to account for potential market fluctuations.

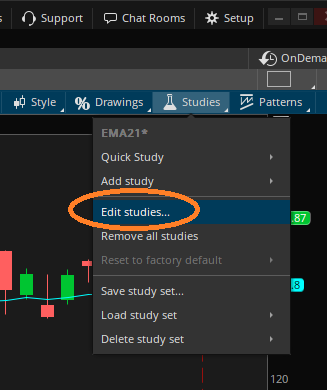
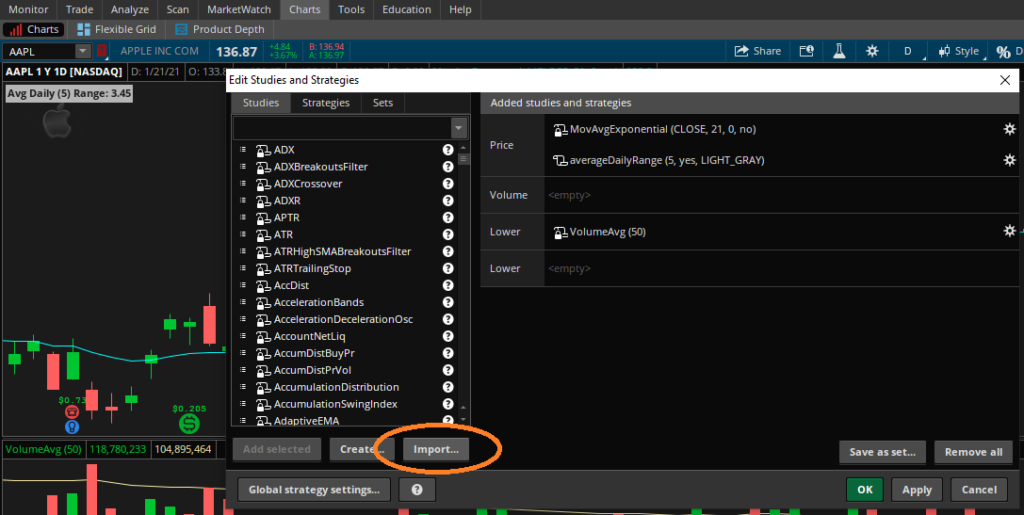
Utilizing Custom Scripts

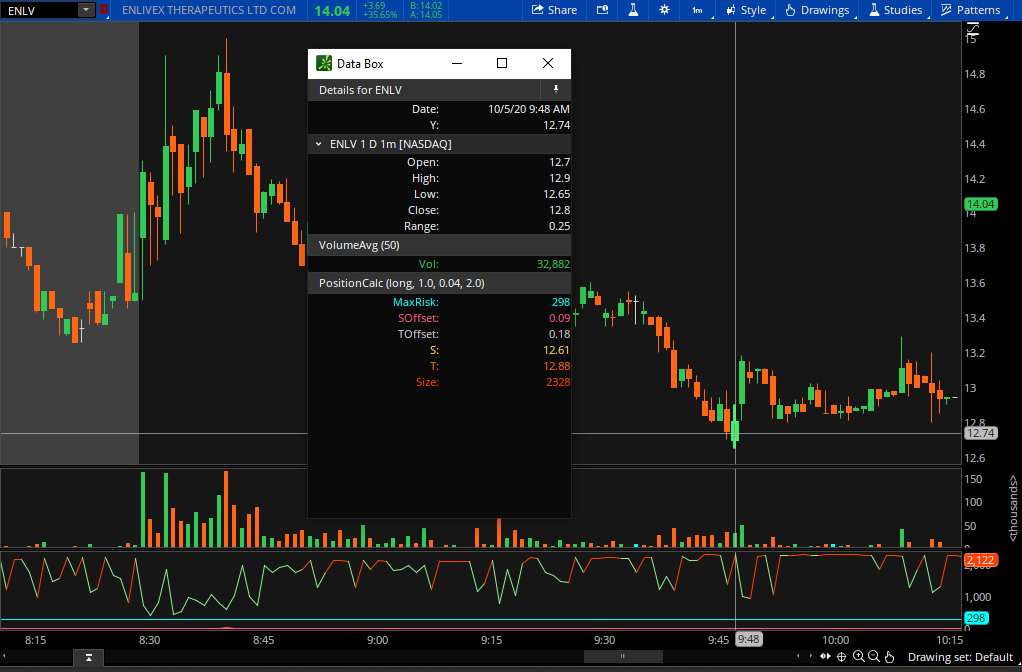
One of the standout features of thinkorswim is its ability to create and implement custom scripts. Traders can develop personalized indicators and strategies based on their unique preferences and trading styles. Whether it’s a custom moving average crossover strategy or a unique combination of technical indicators, the platform allows for endless possibilities in optimizing entry and exit signals.

thinkorswim’s thinkScript language allows traders to create custom indicators and strategies. Traders can develop scripts to generate personalized signals based on unique technical analysis criteria. This customization ensures that indicators align with individual trading styles and preferences.

Backtesting and Analyzing Strategies

Before implementing any strategy, it’s essential to backtest and analyze its historical performance. thinkorswim provides a robust backtesting feature that allows traders to simulate their strategies on historical data. This invaluable tool enables traders to assess the effectiveness of their entry and exit signals under various market conditions, helping refine and optimize their approach.

thinkorswim’s Strategy Roller feature enables traders to backtest their strategies on historical data. This allows for a thorough analysis of how a particular strategy would have performed in past market conditions. Traders can identify strengths and weaknesses, refine parameters, and optimize their strategies for better performance.

Mastering the skill of entering and exiting positions is a continuous journey. thinkorswim, with its array of sophisticated indicators and analytical tools, empowers traders to make well-informed decisions. By leveraging these indicators, traders can enhance their ability to identify trends, time entries and exits, and manage risk effectively. As with any trading strategy, it’s crucial to combine technical analysis with a solid understanding of market fundamentals and risk management. With thinkorswim’s comprehensive toolkit, traders have the resources they need to navigate the markets with confidence and precision. Happy 2024!

Mastering Trading Strategies with Thinkorswim: Unleashing the Power of Buy and Sell Signal Scripts

In the fast-paced world of trading, having access to advanced tools and platforms can make all the difference. Thinkorswim, a leading trading platform by TD Ameritrade (now owned by Charles Schwab), provides traders with a comprehensive suite of features to analyze, execute, and manage trades effectively. Among its many capabilities, Thinkorswim offers the ability to create and leverage custom scripts, enabling traders to generate powerful buy and sell signals. In this blog post, we will explore how Thinkorswim’s scripting capabilities can enhance your trading strategies and help you make informed decisions.

Understanding thinkScript

At the heart of Thinkorswim’s scripting capabilities lies thinkScript, a proprietary scripting language designed specifically for the platform. thinkScript allows traders to create custom studies, indicators, and strategies to analyze market data and generate personalized trading signals. Just because it’s a proprietary scripting language, however, doesn’t mean you must know how to write code to utilize these powerful tools. More on that later.

Creating Custom Buy and Sell Signals

With thinkScript, traders can develop custom scripts to identify specific market conditions and generate buy and sell signals accordingly. This opens up a world of possibilities, enabling you to tailor your trading strategy to your unique preferences and risk tolerance.

To create a custom signal, you can define the conditions that must be met for a buy or sell signal to trigger. These conditions can include technical indicators, moving averages, trend lines, or any other parameters relevant to your trading strategy. Once the conditions are met, thinkorswim will automatically generate alerts or even execute trades on your behalf.

Backtesting and Optimization

One of the most valuable features of thinkorswim is its ability to backtest and optimize custom scripts. Before deploying a trading strategy in real-time, it is crucial to evaluate its performance using historical data. With thinkScript, you can test your custom buy and sell signals against past market conditions to determine their effectiveness.

By backtesting, you can assess the profitability, risk, and overall performance of your strategy. This process helps you identify potential weaknesses or areas for improvement, allowing you to refine and optimize your trading signals over time.

Leveraging Thinkorswim’s Community

As I stated before, just because it’s a proprietary scripting language doesn’t mean you must know how to write code. In fact, the thinkorswim platform boasts a vibrant community of traders who actively share their scripts and strategies. Leveraging this community can provide you with a wealth of knowledge and ideas for building effective trading signals. By exploring shared scripts and indicators, you can gain insights into different trading approaches and adapt them to suit your trading style.

In addition to the great community of traders, there are many companies that create and sell custom indicators, like us :), that provide installation and usage support, as well as regular updates to the code when necessary. Furthermore, the thinkScript Lounge, an online forum dedicated to thinkScript users, is an excellent resource for troubleshooting, seeking advice, and collaborating with fellow traders. Engaging with the community not only expands your understanding of thinkScript but also opens doors to valuable connections and learning opportunities.

Conclusion

Thinkorswim’s powerful scripting capabilities, combined with its comprehensive suite of tools, make it a go-to platform for traders looking to develop and implement custom buy and sell signals. By harnessing the potential of thinkScript, you can create personalized trading strategies that align with your goals and risk tolerance. Remember to backtest and optimize your signals to ensure their effectiveness, and leverage the Thinkorswim community for inspiration and collaboration. With Thinkorswim, you can take your trading to new heights by unleashing the power of custom scripts and unlocking profitable opportunities in the market.

Just remember not to share our code 🙂

Thinkorswim Paper Trading

Paper trading, also known as virtual trading or simulated trading, is a practice in which individuals or investors simulate the process of trading securities without using real money. Instead, they use a simulated trading platform that replicates the actual market conditions and allows users to execute trades, track performance, and monitor the impact of their investment decisions. Paper trading provides a risk-free environment for individuals to gain experience in trading without incurring any financial losses. It is commonly used by novice traders, investors, and students to learn about the dynamics of the financial markets, test investment strategies, and practice executing trades.

In paper trading, users are typically provided with a virtual account balance, which they can use to buy and sell stocks, bonds, options, or other financial instruments based on the current market prices. The platform records the transactions and keeps track of the user’s portfolio value, giving them a realistic sense of how their trades would have performed if they were using real money. By engaging in paper trading, individuals can develop and refine their trading skills, understand market trends, analyze investment strategies, and assess the potential risks and rewards of different trading approaches. It’s a valuable tool for building confidence, experimenting with new investment techniques, and evaluating the performance of specific trading strategies before committing real capital (read, your hard-earned money!) to the market.

Does Thinkorswim offer paper trading?

Yes, Thinkorswim, a popular trading platform developed by TD Ameritrade (now part of Charles Schwab), does offer paper trading capabilities. Thinkorswim’s paper trading feature allows users to practice trading without risking real money. It provides a simulated trading environment where users can execute trades, monitor their portfolios, and test various trading strategies. With Thinkorswim’s paper trading, users can access a wide range of financial instruments, including stocks, options, futures, and forex. The platform provides real-time market data1 and a suite of advanced trading tools and charting capabilities, allowing users to perform technical analysis and make informed trading decisions.

Thinkorswim’s paper trading feature is particularly popular among both beginner and experienced traders who want to practice and refine their strategies before trading with actual funds. It allows users to gain familiarity with the platform’s features, test different order types, assess risk management techniques, and track the performance of their virtual trades.

The difference between paper trading and on-demand

Thinkorswim offers two distinct features for simulated trading: paper trading and on-demand.

  1. Paper Trading: Thinkorswim’s paper trading feature allows users to practice trading in a simulated environment using virtual funds. It replicates real-time market conditions and provides users with a virtual account balance to execute trades, monitor portfolios, and test various trading strategies. Key features of paper trading include:
    • Simulated trading environment: Users can trade stocks, options, futures, and forex using virtual money, enabling them to practice without risking real capital.
    • Real-time market data: Paper trading reflects live market conditions, providing users with access to real-time prices, quotes, and market depth.
    • Tracking and performance analysis: Users can monitor their paper trading portfolio, track trades, and evaluate the performance of their virtual trades over time.
    • Practice and experimentation: Paper trading allows users to test different trading strategies, explore advanced order types, and gain familiarity with the platform’s features.
  1. On-Demand: On-demand is a unique feature within Thinkorswim that enables users to access historical market data and replay it as if it were happening in real-time. Unlike paper trading, on-demand is not limited to simulated trading with virtual funds. Instead, it allows users to review and analyze past market conditions to refine their strategies or learn from historical price movements. Key features of on-demand include:
    • Historical data replay: Users can select specific dates and times and replay the market activity as if it were occurring in real-time.
    • Advanced charting and analysis: Users can apply technical indicators, draw trend lines, and perform analysis on historical data to study patterns and price movements.
    • Strategy evaluation: Traders can test their strategies on historical data, assess their performance, and make adjustments based on past market conditions.
    • Learning and education: On-demand provides an opportunity for traders to review historical events, study market behavior, and enhance their understanding of the markets.

In short, Thinkorswim’s paper trading feature focuses on simulated trading with virtual funds in real-time market conditions, while the on-demand feature allows users to replay historical market data for analysis, strategy refinement, and educational purposes.

Thinkscript

The best part about all of this is that ThinkScript indicators can be used with both Thinkorswim’s paper trading and on-demand features! ThinkScript is a scripting language developed by TD Ameritrade that allows users to create their own custom studies, strategies, and alerts within the Thinkorswim platform.

When using Thinkorswim’s paper trading feature, you can apply your custom ThinkScript indicators to analyze the simulated market data and test your trading strategies. The platform provides a built-in editor where you can write and modify ThinkScript code, and then apply those custom indicators to your paper trading charts.

By utilizing custom ThinkScript indicators while paper trading, you can enhance your analysis, identify potential trade setups, and evaluate the effectiveness of your trading strategies in a simulated environment. This can help you gain confidence in your custom indicators and refine them before using them in live trading with real money.

1. Real-time market data is available only with a funded account, and you must sign the exchange agreements first. Additionally, to remove the delay from your PaperMoney account you’ll need to contact TD Ameritrade support directly either through phone support or by chat.

How is a pullback defined and how do I trade it?

A pullback is a temporary reversal in the direction of an underlying trend. In other words, it is a retracement in price that goes against the current trend. For example, if an asset is in an uptrend and its price starts to fall for a short period before resuming its upward trajectory, that short-term decline is called a pullback. Similarly, if an asset is in a downtrend and its price rises temporarily before resuming its downward trend, that short-term increase is also called a pullback.

Pullbacks can be caused by a variety of factors, such as profit-taking by traders, changes in market sentiment, or unexpected news or events that impact the market. They can be identified by technical analysis tools such as trend lines, moving averages, or chart patterns.

The pullback strategy is a popular one among traders, including day traders. It is a common strategy that is used to take advantage of temporary price retracements within a larger trend. Many traders believe that pullbacks can provide favorable risk-to-reward opportunities because they can offer a chance to enter a trade at a better price than the trend’s current price.

How to trade a pullback

Traders need to identify the direction of the trend to determine whether a pullback is likely to occur. They may use technical analysis tools such as moving averages, trend lines, or chart patterns to identify the trend. Once the trend is identified, traders look for a pullback in price that retraces a portion of the trend’s move. They may use technical indicators such as the Relative Strength Index (RSI) or Moving Average Convergence Divergence (MACD) to confirm the pullback. Day traders look for areas where the price may find support and reverse its direction. They may use previous swing lows, Fibonacci retracement levels, or moving averages as potential support levels.

Traders may wait for confirmation that the pullback is ending and the trend is resuming before entering a trade. They may look for bullish candlestick patterns, a break of a trend line, or a bounce off a support level as confirmation. Once the confirmation is received, traders may enter a long position with a stop loss order just below the support level. They may also set a profit target based on the previous swing high or a Fibonacci extension level.

Traders need to manage their trade by monitoring the price action and adjusting their stop loss and profit target levels as the trade progresses. They may also use trailing stop orders to lock in profits as the price moves in their favor.

What are the Trade For Me rules for trading a pullback?

  1. There must be a sequential series of retracing bars that do not exceed the average range. Our favorite average for intraday trading is 20 periods.
  2. There must be at least two (2) or more lower highs for a long entry, or two (2) or more higher lows for a short entry.
  3. It must be the first or second pullback of a stage 2 uptrend or coming from a double bottom retest.
  4. Long entry: A buy stop limit order is placed with a stop one penny above the high of the lowest pullback bar. The limit is a few pennies higher than the stop. The stop loss is just below the pullback bar. Add padding of a few pennies to the stop loss. The target is your risk (entry price – stop loss) x 2 + entry price.
  5. Short entry: A sell stop limit order is placed with a stop one penny below the low of the highest pullback bar. The limit is a few pennies lower than the stop. The stop loss is just above the pullback bar. Add padding of a few pennies to the stop loss. The target is your risk (entry price – stop loss) x 2 + entry price.

The pullback indicator for thinkorswim (TOS) has an audible alert when the pattern sets up, so you won’t miss an entry. Like everything with trading, there is no perfect system, so it attempts to find only the best patterns so you don’t miss them. It’s important to note, however, that even though a pattern sets up that appears to be just right, if it doesn’t adhere to the rules above, the trade should not be taken. Specifically, we’re talking about rule #3. It’s very difficult, if not impossible, to determine the long term trend programmatically using an indicator. You will have to rely on your ability to assess where the pattern is coming from to be successful.

Find other tips, tricks, and content on these other fine social media platforms. Please subscribe/follow to stay informed of the latest content!

How to create a thinkorswim (TOS) dollar gainer scan

If you’re just starting out, be sure to visit the thinkorswim Learning Center first. The video on that page describes how to get started with creating your first scan. I’ll keep this simple, and even provide the code for you! In this scan we will meet the following criteria. 1) The stock must have gained at least one dollar from the previous day’s close during the pre-market trading session. The pre-market is defined as the time between 4:00am and 9:29am. 2) The pre-market cumulative volume must exceed 5,000 shares traded. Here are the steps to create a thinkorswim (TOS) dollar gainer scan. Feel free to update the change and preMktVolMin variables to meet your needs.

  1. For the “Scan in:” section, choose All Stocks from the Category list
  2. For the “Exclude:” section, choose All OTC Stocks from the Category list (unless you like to trade OTC stocks, of course)
  3. Add a filter using the “+ Add filter” button. Choose Stock. Under the first drop-down, choose Last and set the min and max price for the stocks you like to trade
  4. Add another filter. This time choose Study. At the bottom of the first drop-down list, choose custom. A window will open. Click the “thinkScript Editor” tab at the top of the window. Also, change the Aggregation (also at the top of the window) to 1 min. Remove the default code from the editor window and copy/paste the code from below. Update the “change” or “preMktVolMin” variable values as needed.
  5. Add another “Stock” filter. Set it to a Market cap min. of 1M. This will filter out some things that are not stocks.
def change = 1.00;
def preMktVolMin = 50000;
def mktClose = 1559;
def preMktStart = 0400;
def preMktEnd = 0929;
rec closePrice = CompoundValue(1, if SecondsTillTime(mktClose) == 0 then close else closePrice[1], close);
def gainers = (close - closePrice) >= change;
def preMkt = SecondsFromTime(preMktStart) >= 0 and SecondsTillTime(preMktEnd) >= 0;
def preMktVol = if preMkt and !preMkt[1] then volume else if preMkt then preMktVol[1] + volume else preMktVol[1];
plot scan = preMkt and gainers and preMktVol > preMktVolMin;
  1. Click OK to exit the window.
  2. Click the menu to the far right of the “Add condition group” button, and click “Save scan query…”
  3. Give your scan a name, and save it.
  4. Click the Scan button and await your results! NOTE: If you’re not scanning during the pre-market, you’ll get no results.

Find other tips, tricks, and content on these other fine social media platforms. Please subscribe/follow to stay informed of the latest content!

How to view the Position Size Calculator for thinkorswim

Once you’ve installed the Position Size Calculator for thinkorswim you may be asking yourself how to actually view the calculations. Some thinkScripts overlay things on your charts, but this particular script adds calculations to the data box. In this post, I’ll describe how you can enable to floating data box so you may easily view the position size calculations. Before you proceed, be sure that the indicator is installed in one of the “lower” positons of the edit studies area. Placing it on the “Price” or “Volume” area will smush the candles on the chart.

Data Box is a tool that displays values from the status string on chart. Once enabled, Data Box displays OHLC and study values for the bar under the cursor. As you move the cursor across the chart, values change in the same manner as in the status string.

In order to enable Data Box, choose Settings from the Style menu and activate Data Box item on the General tab. Choose Floating to make the Data Box follow the cursor or Fixed to display it as a separate element. Choose Off so that the Data Box will not be shown. You can also turn off the status string since the values are displayed in Data Box.

If you chose to use the Fixed mode, Data Box will appear as a separate element: you can move it to whichever position you prefer. This mode will also restore this position if you restart the application. There is also an option to display it above all opened windows so that it will be visible even if you minimize the application window; in order to do so, click the Pin button at the top of the Data box. Note that if you use a grid of charts, Fixed mode will show values for the chart under cursor.

In the Floating mode, Data Box will follow the cursor, so, the list of displayed values is not customizable. Consider using the Synchronize crosshairs position option on General tab of Chart settings in order to display separate Data Boxes for each chart in a grid. Note that in the Floating mode, Data Box will be hidden if the size of chart window is not sufficient to display it.

TD Ameritrade Learning Center

I have to say, I’m a big fan of the floating mode. It allows me to place the data box on another screen so it doesn’t interfere with my charts and other account information that I like to leave up. Also, when it’s in fixed mode, there’s very little data you can actually see if you’re screen isn’t super wide, so for me it’s practically useless in that mode.

Find other tips, tricks, and content on these other fine social media platforms. Please subscribe/follow to stay informed of the latest content!

How to install thinkorswim (TOS) studies

thinkorswim study installation steps

Installing the studies into your thinkorswim platform takes only a few moments. After purchase, you will be provided a download link. The downloaded file will be in a .zip archive format and you will need to extract the contents of the .zip file before installation. On a mac, simply double-click the zip archive to extract it into a folder with the same name as the .zip. On a Windows computer, right-click and choose “Extract All” from the context menu. You will be provided with an option where you would like to save the extracted files.

1. Select studies menu, then edit studies

thinkorswim edit studies

2. Choose the import option

thinkorswim import

3. Navigate to and choose the name_of_script_here_STUDY.ts file from the .zip archive

thinkorswim (tos) navigate

4. Rejoice! You’ve successfully installed the thinkorswim (tos) study into your platform!

Find other tips, tricks, and content on these other fine social media platforms. Please subscribe/follow to stay informed of the latest content!