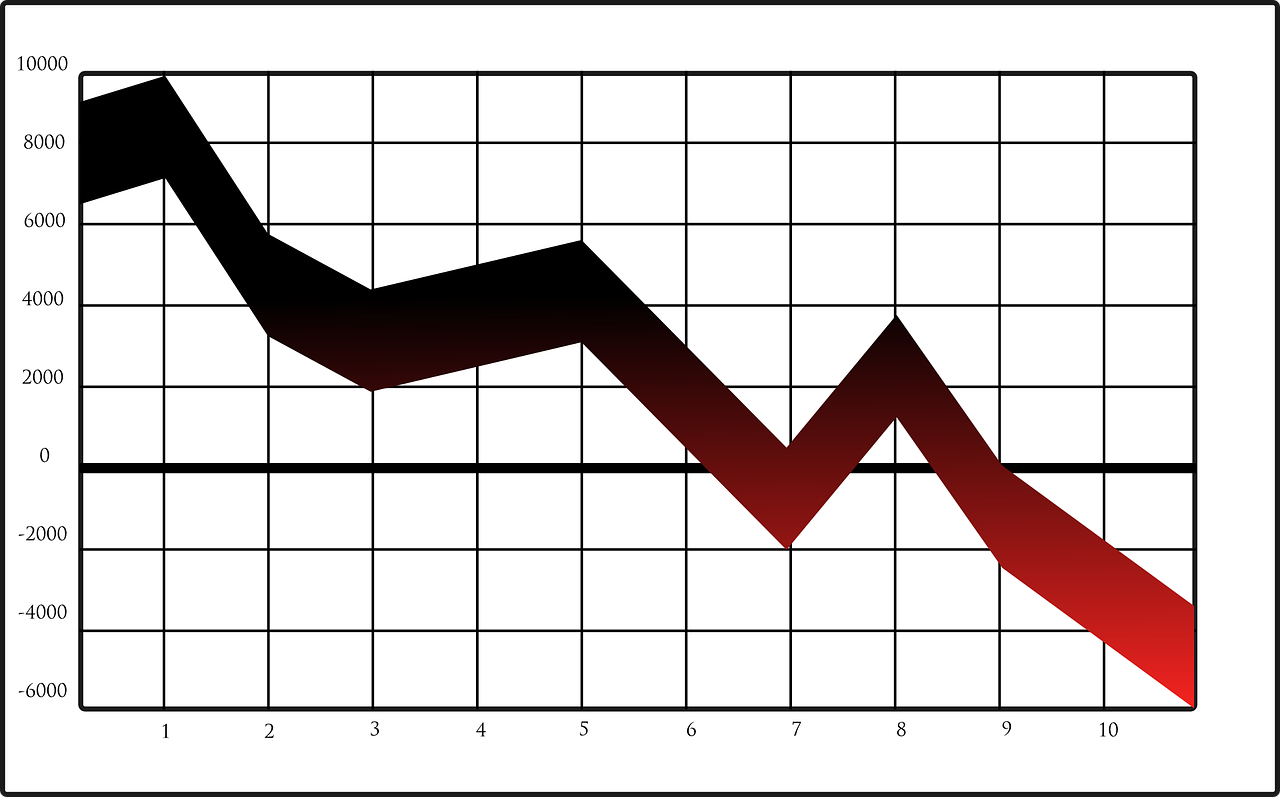
A pullback is a temporary reversal in the direction of an underlying trend. In other words, it is a retracement in price that goes against the current trend. For example, if an asset is in an uptrend and its price starts to fall for a short period before resuming its upward trajectory, that short-term decline is called a pullback. Similarly, if an asset is in a downtrend and its price rises temporarily before resuming its downward trend, that short-term increase is also called a pullback.
Pullbacks can be caused by a variety of factors, such as profit-taking by traders, changes in market sentiment, or unexpected news or events that impact the market. They can be identified by technical analysis tools such as trend lines, moving averages, or chart patterns.
The pullback strategy is a popular one among traders, including day traders. It is a common strategy that is used to take advantage of temporary price retracements within a larger trend. Many traders believe that pullbacks can provide favorable risk-to-reward opportunities because they can offer a chance to enter a trade at a better price than the trend’s current price.
How to trade a pullback
Traders need to identify the direction of the trend to determine whether a pullback is likely to occur. They may use technical analysis tools such as moving averages, trend lines, or chart patterns to identify the trend. Once the trend is identified, traders look for a pullback in price that retraces a portion of the trend’s move. They may use technical indicators such as the Relative Strength Index (RSI) or Moving Average Convergence Divergence (MACD) to confirm the pullback. Day traders look for areas where the price may find support and reverse its direction. They may use previous swing lows, Fibonacci retracement levels, or moving averages as potential support levels.
Traders may wait for confirmation that the pullback is ending and the trend is resuming before entering a trade. They may look for bullish candlestick patterns, a break of a trend line, or a bounce off a support level as confirmation. Once the confirmation is received, traders may enter a long position with a stop loss order just below the support level. They may also set a profit target based on the previous swing high or a Fibonacci extension level.
Traders need to manage their trade by monitoring the price action and adjusting their stop loss and profit target levels as the trade progresses. They may also use trailing stop orders to lock in profits as the price moves in their favor.
What are the Trade For Me rules for trading a pullback?
- There must be a sequential series of retracing bars that do not exceed the average range. Our favorite average for intraday trading is 20 periods.
- There must be at least two (2) or more lower highs for a long entry, or two (2) or more higher lows for a short entry.
- It must be the first or second pullback of a stage 2 uptrend or coming from a double bottom retest.
- Long entry: A buy stop limit order is placed with a stop one penny above the high of the lowest pullback bar. The limit is a few pennies higher than the stop. The stop loss is just below the pullback bar. Add padding of a few pennies to the stop loss. The target is your risk (entry price – stop loss) x 2 + entry price.
- Short entry: A sell stop limit order is placed with a stop one penny below the low of the highest pullback bar. The limit is a few pennies lower than the stop. The stop loss is just above the pullback bar. Add padding of a few pennies to the stop loss. The target is your risk (entry price – stop loss) x 2 + entry price.
The pullback indicator for thinkorswim (TOS) has an audible alert when the pattern sets up, so you won’t miss an entry. Like everything with trading, there is no perfect system, so it attempts to find only the best patterns so you don’t miss them. It’s important to note, however, that even though a pattern sets up that appears to be just right, if it doesn’t adhere to the rules above, the trade should not be taken. Specifically, we’re talking about rule #3. It’s very difficult, if not impossible, to determine the long term trend programmatically using an indicator. You will have to rely on your ability to assess where the pattern is coming from to be successful.

Pullback indicator for Thinkorswim (TOS) with alert
Find other tips, tricks, and content on these other fine social media platforms. Please subscribe/follow to stay informed of the latest content!
