Mastering Trade Entries and Exits with thinkorswim Indicators in 2024

Successful trading is a delicate balance of skill, strategy, and timing. One of the key elements in achieving profitability in the market is mastering the art of entering and exiting positions at the right time. thinkorswim, a powerful trading platform by TD Ameritrade (now the platform is owned by Charles Schwab), provides traders with a comprehensive suite of indicators that can significantly enhance decision-making processes. In this blog post, we’ll explore how thinkorswim indicators can be invaluable tools for traders aiming to optimize their entry and exit points.

Understanding Market Trends

Before executing any trade, it’s crucial to identify the prevailing market trend. thinkorswim offers a variety of trend indicators such as Moving Averages, Bollinger Bands, and the Average True Range (ATR). These indicators help traders analyze the direction and strength of the market, aiding them in making informed decisions on when to enter or exit a position.

  • Moving Averages (MA): Moving averages, available in various forms (simple, exponential, weighted), smooth out price data to create a trend-following indicator. Traders use MAs to identify the direction of the trend. Crossovers between short-term and long-term MAs can signal potential trend reversals or continuations.
  • Bollinger Bands: These consist of a middle band being an MA and two outer bands representing standard deviations. Bollinger Bands help traders identify overbought or oversold conditions and potential price reversals when the price touches or exceeds the outer bands.
  • Average True Range (ATR): ATR measures market volatility, providing insights into potential price movements. Traders can use ATR to set stop-loss and take-profit levels based on the current market conditions.

Timing Entry Points

The Relative Strength Index (RSI) and the Moving Average Convergence Divergence (MACD) are powerful tools for timing entry points. RSI indicates overbought or oversold conditions, signaling potential reversal points. MACD, on the other hand, provides insights into the momentum of a trend, helping traders identify optimal entry opportunities.

  • Relative Strength Index (RSI): RSI measures the speed and change of price movements. An RSI above 70 suggests overbought conditions, indicating a potential reversal, while an RSI below 30 suggests oversold conditions, signaling a possible buying opportunity.
  • Moving Average Convergence Divergence (MACD): MACD consists of two lines – the MACD line and the signal line. Crossovers between these lines provide buy or sell signals. Additionally, MACD histogram bars indicate the strength of the trend.

Setting Stop-Loss and Take-Profit Levels

Managing risk is a crucial aspect of successful trading. thinkorswim’s ATR indicator can be immensely helpful in setting appropriate stop-loss and take-profit levels. By understanding the average volatility of a security, traders can establish realistic expectations and mitigate potential losses by placing stops at strategic levels.

ATR can help traders set dynamic stop-loss levels by considering the current volatility. For example, a trader may set a stop-loss at 1.5 times the ATR below the entry price to account for potential market fluctuations.

Utilizing Custom Scripts

One of the standout features of thinkorswim is its ability to create and implement custom scripts. Traders can develop personalized indicators and strategies based on their unique preferences and trading styles. Whether it’s a custom moving average crossover strategy or a unique combination of technical indicators, the platform allows for endless possibilities in optimizing entry and exit signals.

thinkorswim’s thinkScript language allows traders to create custom indicators and strategies. Traders can develop scripts to generate personalized signals based on unique technical analysis criteria. This customization ensures that indicators align with individual trading styles and preferences.

Backtesting and Analyzing Strategies

Before implementing any strategy, it’s essential to backtest and analyze its historical performance. thinkorswim provides a robust backtesting feature that allows traders to simulate their strategies on historical data. This invaluable tool enables traders to assess the effectiveness of their entry and exit signals under various market conditions, helping refine and optimize their approach.

thinkorswim’s Strategy Roller feature enables traders to backtest their strategies on historical data. This allows for a thorough analysis of how a particular strategy would have performed in past market conditions. Traders can identify strengths and weaknesses, refine parameters, and optimize their strategies for better performance.

Mastering the skill of entering and exiting positions is a continuous journey. thinkorswim, with its array of sophisticated indicators and analytical tools, empowers traders to make well-informed decisions. By leveraging these indicators, traders can enhance their ability to identify trends, time entries and exits, and manage risk effectively. As with any trading strategy, it’s crucial to combine technical analysis with a solid understanding of market fundamentals and risk management. With thinkorswim’s comprehensive toolkit, traders have the resources they need to navigate the markets with confidence and precision. Happy 2024!

Unlocking Profit Potential: Trading Stocks with Standard Deviation and Mean Reversion

Introduction

Stock trading can be a complex and challenging endeavor, requiring investors to navigate through a sea of market fluctuations and uncertainties. However, there are powerful tools and concepts that can assist traders in making informed decisions. In this blog post, we will explore two key concepts that can significantly enhance stock trading strategies: standard deviation and mean reversion.

Standard deviation is a fundamental measure of volatility and risk in stock prices. By analyzing standard deviation, traders can gain insights into the price movements and potential risks associated with specific stocks. It provides a quantifiable metric to gauge the magnitude of price fluctuations and assess the likelihood of future price changes.

Mean reversion, on the other hand, is a trading strategy that operates on the belief that stock prices tend to oscillate around their average or mean value over time. By identifying instances where prices deviate significantly from their mean, traders can potentially capitalize on market inefficiencies. Mean reversion allows traders to spot overbought or oversold stocks, suggesting potential opportunities for profit when prices eventually revert back to their mean.

In this blog post, we will delve deeper into these concepts and demonstrate how traders can combine standard deviation and mean reversion to develop effective trading strategies. By leveraging the information provided by standard deviation and using mean reversion principles to guide entry and exit points, traders can improve their decision-making process and increase their chances of success. We’ll also provide practical examples and tips for implementing a trading strategy that incorporates standard deviation and mean reversion. By the end, you will have a solid foundation to explore these concepts further and potentially enhance your own stock trading approach. So, let’s dive in and uncover the power of standard deviation and mean reversion in the world of stock trading.

Understanding Standard Deviation in Stock Trading

Standard deviation plays a crucial role in stock trading as it provides valuable insights into the volatility and risk associated with stock prices. By understanding standard deviation, traders can make more informed decisions and assess potential trading opportunities. Let’s explore this concept further:

Standard deviation is a statistical measure that quantifies the dispersion of a dataset from its mean. In finance, it is commonly used to measure the volatility or variability of stock prices. A higher standard deviation indicates greater price fluctuations, indicating higher risk, while a lower standard deviation suggests relatively stable price movements. By calculating the standard deviation of historical stock prices, traders can gain insights into the level of volatility a stock exhibits. Volatile stocks with higher standard deviations tend to experience larger price swings, making them riskier investments. On the other hand, stocks with lower standard deviations are considered less volatile and may appeal to investors seeking stability.

Let’s consider two hypothetical stocks, Stock A and Stock B. Stock A has a standard deviation of 5%, while Stock B has a standard deviation of 20%. This indicates that Stock B exhibits higher price volatility compared to Stock A. Traders can use this information to assess their risk tolerance and make decisions accordingly.

Standard deviation can help traders identify potential trading opportunities by highlighting stocks with abnormal price movements. When a stock’s price deviates significantly from its historical standard deviation, it may indicate an overbought or oversold condition, suggesting a potential reversal in price. By monitoring standard deviation levels, traders can identify potential entry or exit points for their trades. Understanding standard deviation empowers traders to assess the risk associated with different stocks and make informed decisions. By incorporating standard deviation analysis into their trading strategies, traders can gauge market volatility and identify potential opportunities to capitalize on price movements. In the next section, we will explore mean reversion, another powerful concept that complements standard deviation in stock trading.

Mean Reversion: A Powerful Trading Strategy

Mean reversion is a trading strategy that capitalizes on the belief that stock prices tend to oscillate around their average or mean value over time. This concept is widely used by traders to identify opportunities when prices deviate significantly from their mean. Let’s delve deeper into mean reversion and its application in stock trading:

Mean reversion is the idea that stock prices, after experiencing significant deviations from their mean, are likely to revert back to their average value. This occurs due to the forces of supply and demand, as well as market participants’ reactions to price extremes. Mean reversion traders aim to profit by taking positions when prices are expected to revert to their mean.

Stock prices rarely move in a straight line. Instead, they exhibit a tendency to fluctuate above and below their average value. Mean reversion traders identify these price swings and take advantage of the potential reversals when prices move too far away from their mean. They anticipate that the price will eventually return to a more reasonable level.

Mean reversion allows traders to identify overbought and oversold conditions in stocks. When a stock’s price significantly exceeds its historical average, it may be considered overbought, indicating a potential opportunity to sell or short the stock. Conversely, when a stock’s price falls significantly below its mean, it may be considered oversold, suggesting a potential opportunity to buy or go long on the stock.

Numerous successful trading strategies are based on mean reversion. For example, the “Pairs Trading” strategy involves identifying two stocks that are historically correlated. When one stock’s price significantly deviates from its normal relationship with the other stock, traders can take positions anticipating a reversion to the mean relationship.

Mean reversion offers traders a powerful approach to identify potential trading opportunities. By understanding the tendency of stock prices to oscillate around their mean, traders can anticipate reversals and take advantage of price extremes. However, it is important to note that mean reversion strategies require careful analysis, risk management, and consideration of other market factors.

In the next section, we will explore how standard deviation and mean reversion can be combined to create a robust trading strategy. By integrating these two concepts, traders can enhance their decision-making process and potentially increase their chances of success in the stock market.

Combining Standard Deviation and Mean Reversion for Trading

The combination of standard deviation and mean reversion can provide traders with a powerful framework for identifying potential trading opportunities and improving their overall trading strategy. Let’s explore how these two concepts can be effectively merged:

Standard deviation can assist traders in identifying optimal entry and exit points for their trades. By considering a stock’s current price in relation to its historical standard deviation, traders can gauge whether the stock is trading at an extreme level. If the price deviates significantly from the mean, it may present an opportunity to enter a trade with the expectation of a mean reversion. By combining standard deviation and mean reversion, traders can uncover potential trading opportunities that align with their risk tolerance and strategy. When a stock’s price exhibits a significant deviation from its mean, and this deviation is also accompanied by a high standard deviation, it strengthens the case for a potential mean reversion trade.
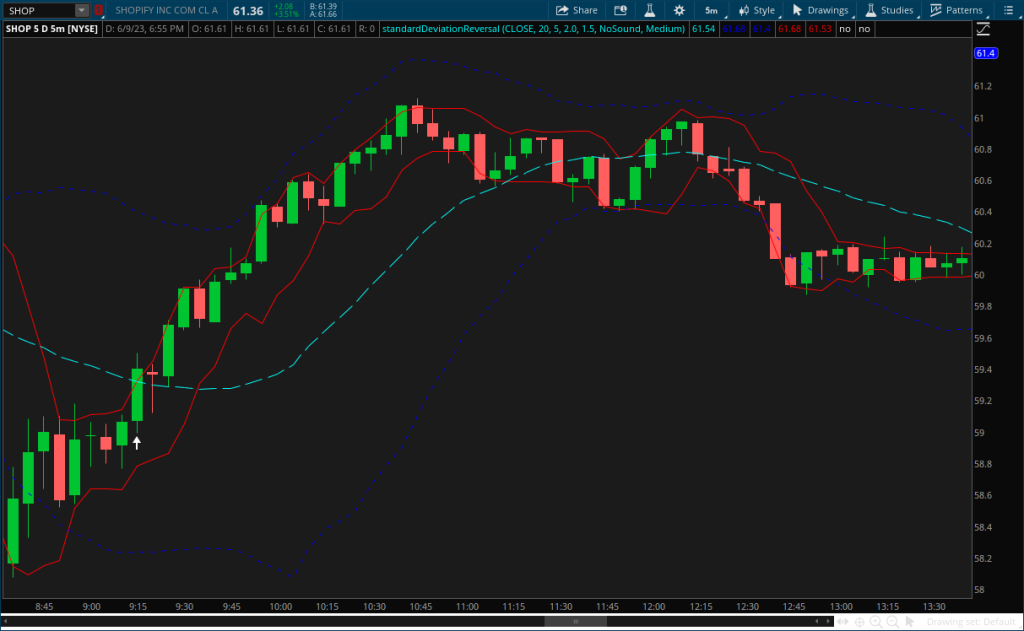
Traders can establish specific trading rules based on the combination of standard deviation and mean reversion. For example, they may decide to enter a trade when a stock’s price exceeds a certain number of standard deviations from its mean, indicating an overbought or oversold condition. Similarly, they may set rules for exiting a trade once the price approaches the mean or reaches a specific profit target. By integrating standard deviation and mean reversion, traders can enhance their trading strategies. This combination allows for a more comprehensive analysis of stock prices, incorporating both volatility and the tendency to revert to the mean.

In the next section, we will discuss the risks and limitations associated with using standard deviation and mean reversion, as well as the importance of implementing effective risk management techniques in trading.

Risks and Limitations

While standard deviation and mean reversion can be powerful tools in stock trading, it’s important to understand and address the risks and limitations associated with these concepts. Traders must approach their strategies with caution and implement effective risk management techniques. Let’s explore these considerations:

  • Market unpredictability: Despite historical data analysis, future market conditions can deviate from historical patterns, leading to unexpected outcomes.
  • Extended periods of deviation: Stocks may remain overbought or oversold for prolonged periods before reverting to their mean, resulting in potential losses if not managed appropriately.
  • False signals: Standard deviation and mean reversion strategies are not foolproof and can generate false signals, leading to incorrect trading decisions.
  • Implementing proper risk management techniques, such as setting stop-loss orders, is crucial to protect against excessive losses.
  • Traders should determine their risk tolerance and establish appropriate risk-reward ratios for each trade to mitigate potential losses.
  • Standard deviation and mean reversion are just two tools in a trader’s toolkit. They should be complemented by other technical and fundamental analysis to gain a more comprehensive understanding of market dynamics.
  • Traders should be aware that no single strategy guarantees success in all market conditions. Flexibility and adaptability are key in adjusting trading strategies based on evolving market conditions.

It is essential for traders to be aware of the risks and limitations associated with using standard deviation and mean reversion in stock trading. By acknowledging these factors, traders can take a proactive approach to mitigate risks, manage losses, and refine their strategies accordingly.

In the next section, we will provide some valuable tips and best practices to effectively incorporate standard deviation and mean reversion into stock trading strategies, maximizing the chances of success while minimizing potential risks.

Tips and Best Practices

Incorporating standard deviation and mean reversion into stock trading strategies requires careful consideration and implementation. To help traders effectively utilize these concepts, here are some valuable tips and best practices:

Understand the historical price behavior of stocks, analyze standard deviation levels, and identify mean reversion opportunities. Supplement standard deviation and mean reversion analysis with other technical indicators and fundamental analysis to confirm potential trading signals. Analyze standard deviation and mean reversion across different timeframes to gain a broader perspective and validate potential trading opportunities.

Continuously monitor market news, economic indicators, and company-specific developments to stay abreast of any factors that may impact stock prices. Adjust trading strategies as market conditions evolve. Market trends and dynamics can shift, requiring traders to adapt their approach accordingly.

Use historical data to simulate and test your trading strategy based on standard deviation and mean reversion. Assess its performance under various market conditions to gain insights into its strengths and weaknesses. Monitor the results of your trades and continuously evaluate the effectiveness of your strategy. Identify areas for improvement and make necessary adjustments to enhance performance.

Implementing these tips and best practices can help traders optimize their strategies and increase their chances of success when incorporating standard deviation and mean reversion. However, it’s important to remember that trading involves inherent risks, and no strategy guarantees profits. Prudent risk management and continuous evaluation of the strategy’s performance are key elements for long-term success.

In the concluding section, we will recap the key points discussed throughout the blog post and emphasize the potential benefits of utilizing standard deviation and mean reversion in stock trading strategies.

Conclusion

Throughout this blog post, we have explored the powerful concepts of standard deviation and mean reversion in stock trading. By understanding and incorporating these concepts into trading strategies, traders can enhance their decision-making process and potentially increase their chances of success. Let’s recap the key points discussed and emphasize the benefits of utilizing standard deviation and mean reversion:

  1. Standard deviation serves as a measure of volatility and risk in stock prices. By analyzing standard deviation, traders can assess the magnitude of price fluctuations and identify potential trading opportunities.
  2. Mean reversion is a trading strategy that takes advantage of the tendency of stock prices to revert back to their mean value over time. By identifying price deviations from the mean, traders can anticipate potential reversals and capitalize on price extremes.
  3. Combining standard deviation and mean reversion allows traders to enhance their trading strategies. By utilizing standard deviation to determine entry and exit points and incorporating mean reversion principles, traders can identify overbought and oversold conditions and make more informed trading decisions.
  4. It is important to recognize the risks and limitations associated with these concepts. Market unpredictability, extended periods of deviation, and false signals can pose challenges. Implementing effective risk management techniques and considering additional analysis can help mitigate these risks.
  5. Practical tips such as thorough research, using multiple indicators, staying informed about market trends, and evaluating strategy performance through backtesting are essential for successful implementation.

By incorporating these concepts and following best practices, traders can gain a deeper understanding of market dynamics, improve their trading strategies, and potentially increase their profitability.

So, as you embark on your stock trading journey, consider the power of standard deviation and mean reversion. Explore, experiment, and develop your own unique trading approach. With the right knowledge, strategy, and risk management, you can navigate the stock market with confidence and aim for success.

As always, good luck and happy trading!

What’s the Difference between Stop-Loss & Stop-Limit Orders

Stop order overview

A stop order, also known as a stop-loss order, is a type of order used in stock trading to limit potential losses or protect gains on a particular stock. It is an instruction given by an investor to their broker or trading platform to buy or sell a stock once it reaches a specified price level, known as the “stop price.”

There are two types of stop orders: buy stop orders and sell stop orders. A buy stop order is a type of stop order placed above the current market price. It’s used to trigger a buy order when the stock’s price rises and reaches the specified stop price. Once the stop price is reached, the buy stop order is executed as a market order, and the investor purchases the stock at the prevailing market price. A sell stop order is a type of stop order placed below the current market price. It’s used to trigger a sell order when the stock’s price falls and reaches the specified stop price. Once the stop price is reached, the sell stop order is executed as a market order, and the investor sells the stock at the prevailing market price.

The purpose of a stop order is to help investors limit their potential losses by automatically triggering a trade when the stock price reaches a certain level. It is particularly useful for managing risk, especially when the investor is unable to actively monitor the market. By using a stop order, investors can set predetermined exit points to protect themselves from significant losses if the stock price moves against their expectations.

Once a stop order is triggered, it becomes a market order, which means it will be executed at the best available price, but it may not necessarily be executed at the exact stop price. In cases of extreme market volatility or gaps in the stock’s price, the execution price of a stop order may differ from the stop price. It’s for that reason that at Trade For Me, we never use stop orders to enter a trade. We only use them to exit.

What’s the difference in a stop limit order?

The main difference between a stop loss order and a stop limit order lies in how they’re executed once the specified stop price is reached. Here’s a breakdown of each order type:

  • Stop Loss Order: A stop loss order is an order to sell a stock (or buy in the case of a buy stop loss order) when the stock’s price reaches or goes below a specified stop price. Once the stop price is reached, the stop loss order is converted into a market order and executed at the best available price in the market. The execution of the order is guaranteed, but the exact execution price may vary depending on market conditions, particularly in cases of high volatility.

For example, if you own a stock currently priced at $50 and you set a stop loss order with a stop price of $45, if the stock’s price drops to $45 or below, your stop loss order will be triggered and executed as a market order. It means you will sell the stock at the prevailing market price, which could be slightly higher or lower than $45.

  • Stop Limit Order: A stop limit order combines elements of both a stop order and a limit order. With a stop limit order, once the stock’s price reaches or goes below the specified stop price, the order is converted into a limit order with a specified limit price. The limit price sets the maximum or minimum price at which the investor is willing to buy or sell the stock.

For example, suppose you set a stop limit order to sell a stock with a stop price of $45 and a limit price of $44. If the stock’s price reaches or drops below $45, the stop limit order is triggered and converted into a limit order with a limit price of $44. The order will then only be executed if it can be filled at a price of $44 or better. If the stock’s price drops below $44 and cannot be executed at that price, the order will remain unfilled.

As another example, let’s say you’ve been monitoring a stock which is currently trading at $50 per share. You believe that if the stock price reaches $55, it will indicate a bullish breakout, and you want to enter a long position to capitalize on potential further price increases. However, you also want to have control over the price at which you enter the trade. In this scenario, you can use a buy stop limit order.

You decide to place a buy stop limit order with the following parameters:

  • Stop Price: $55
  • Limit Price: $56

Once the stock price reaches or surpasses $55, your buy stop limit order is triggered, and it converts into a limit order with a limit price of $56. The order is now in the market, waiting to be executed.

If the stock’s price reaches $55, your buy stop limit order is activated. However, the order will only be executed if it can be filled at $56 or a better price. This allows you to have control over the maximum price you’re willing to pay for the stock. If the stock’s price rises above $56, the order will be executed at $56 or lower. If the stock’s price does not reach $56, the order remains unfilled.

By using a buy stop limit order in this bullish scenario, you can ensure that you enter the trade once the stock price confirms your bullish sentiment (reaches $55), while also having a defined limit price ($56) to control the maximum price you’re willing to pay.

The key distinction between a stop loss order and a stop limit order is that a stop loss order is executed as a market order, whereas a stop limit order is converted into a limit order. This means that while a stop loss order guarantees execution, a stop limit order does not guarantee execution, as it depends on whether the limit price can be met in the market.

Consider this Forbes article during your research into stop order types and their benefits.

Mastering Trading Strategies with Thinkorswim: Unleashing the Power of Buy and Sell Signal Scripts

In the fast-paced world of trading, having access to advanced tools and platforms can make all the difference. Thinkorswim, a leading trading platform by TD Ameritrade (now owned by Charles Schwab), provides traders with a comprehensive suite of features to analyze, execute, and manage trades effectively. Among its many capabilities, Thinkorswim offers the ability to create and leverage custom scripts, enabling traders to generate powerful buy and sell signals. In this blog post, we will explore how Thinkorswim’s scripting capabilities can enhance your trading strategies and help you make informed decisions.

Understanding thinkScript

At the heart of Thinkorswim’s scripting capabilities lies thinkScript, a proprietary scripting language designed specifically for the platform. thinkScript allows traders to create custom studies, indicators, and strategies to analyze market data and generate personalized trading signals. Just because it’s a proprietary scripting language, however, doesn’t mean you must know how to write code to utilize these powerful tools. More on that later.

Creating Custom Buy and Sell Signals

With thinkScript, traders can develop custom scripts to identify specific market conditions and generate buy and sell signals accordingly. This opens up a world of possibilities, enabling you to tailor your trading strategy to your unique preferences and risk tolerance.

To create a custom signal, you can define the conditions that must be met for a buy or sell signal to trigger. These conditions can include technical indicators, moving averages, trend lines, or any other parameters relevant to your trading strategy. Once the conditions are met, thinkorswim will automatically generate alerts or even execute trades on your behalf.

Backtesting and Optimization

One of the most valuable features of thinkorswim is its ability to backtest and optimize custom scripts. Before deploying a trading strategy in real-time, it is crucial to evaluate its performance using historical data. With thinkScript, you can test your custom buy and sell signals against past market conditions to determine their effectiveness.

By backtesting, you can assess the profitability, risk, and overall performance of your strategy. This process helps you identify potential weaknesses or areas for improvement, allowing you to refine and optimize your trading signals over time.

Leveraging Thinkorswim’s Community

As I stated before, just because it’s a proprietary scripting language doesn’t mean you must know how to write code. In fact, the thinkorswim platform boasts a vibrant community of traders who actively share their scripts and strategies. Leveraging this community can provide you with a wealth of knowledge and ideas for building effective trading signals. By exploring shared scripts and indicators, you can gain insights into different trading approaches and adapt them to suit your trading style.

In addition to the great community of traders, there are many companies that create and sell custom indicators, like us :), that provide installation and usage support, as well as regular updates to the code when necessary. Furthermore, the thinkScript Lounge, an online forum dedicated to thinkScript users, is an excellent resource for troubleshooting, seeking advice, and collaborating with fellow traders. Engaging with the community not only expands your understanding of thinkScript but also opens doors to valuable connections and learning opportunities.

Conclusion

Thinkorswim’s powerful scripting capabilities, combined with its comprehensive suite of tools, make it a go-to platform for traders looking to develop and implement custom buy and sell signals. By harnessing the potential of thinkScript, you can create personalized trading strategies that align with your goals and risk tolerance. Remember to backtest and optimize your signals to ensure their effectiveness, and leverage the Thinkorswim community for inspiration and collaboration. With Thinkorswim, you can take your trading to new heights by unleashing the power of custom scripts and unlocking profitable opportunities in the market.

Just remember not to share our code 🙂

Thinkorswim Paper Trading

Paper trading, also known as virtual trading or simulated trading, is a practice in which individuals or investors simulate the process of trading securities without using real money. Instead, they use a simulated trading platform that replicates the actual market conditions and allows users to execute trades, track performance, and monitor the impact of their investment decisions. Paper trading provides a risk-free environment for individuals to gain experience in trading without incurring any financial losses. It is commonly used by novice traders, investors, and students to learn about the dynamics of the financial markets, test investment strategies, and practice executing trades.

In paper trading, users are typically provided with a virtual account balance, which they can use to buy and sell stocks, bonds, options, or other financial instruments based on the current market prices. The platform records the transactions and keeps track of the user’s portfolio value, giving them a realistic sense of how their trades would have performed if they were using real money. By engaging in paper trading, individuals can develop and refine their trading skills, understand market trends, analyze investment strategies, and assess the potential risks and rewards of different trading approaches. It’s a valuable tool for building confidence, experimenting with new investment techniques, and evaluating the performance of specific trading strategies before committing real capital (read, your hard-earned money!) to the market.

Does Thinkorswim offer paper trading?

Yes, Thinkorswim, a popular trading platform developed by TD Ameritrade (now part of Charles Schwab), does offer paper trading capabilities. Thinkorswim’s paper trading feature allows users to practice trading without risking real money. It provides a simulated trading environment where users can execute trades, monitor their portfolios, and test various trading strategies. With Thinkorswim’s paper trading, users can access a wide range of financial instruments, including stocks, options, futures, and forex. The platform provides real-time market data1 and a suite of advanced trading tools and charting capabilities, allowing users to perform technical analysis and make informed trading decisions.

Thinkorswim’s paper trading feature is particularly popular among both beginner and experienced traders who want to practice and refine their strategies before trading with actual funds. It allows users to gain familiarity with the platform’s features, test different order types, assess risk management techniques, and track the performance of their virtual trades.

The difference between paper trading and on-demand

Thinkorswim offers two distinct features for simulated trading: paper trading and on-demand.

  1. Paper Trading: Thinkorswim’s paper trading feature allows users to practice trading in a simulated environment using virtual funds. It replicates real-time market conditions and provides users with a virtual account balance to execute trades, monitor portfolios, and test various trading strategies. Key features of paper trading include:
    • Simulated trading environment: Users can trade stocks, options, futures, and forex using virtual money, enabling them to practice without risking real capital.
    • Real-time market data: Paper trading reflects live market conditions, providing users with access to real-time prices, quotes, and market depth.
    • Tracking and performance analysis: Users can monitor their paper trading portfolio, track trades, and evaluate the performance of their virtual trades over time.
    • Practice and experimentation: Paper trading allows users to test different trading strategies, explore advanced order types, and gain familiarity with the platform’s features.
  1. On-Demand: On-demand is a unique feature within Thinkorswim that enables users to access historical market data and replay it as if it were happening in real-time. Unlike paper trading, on-demand is not limited to simulated trading with virtual funds. Instead, it allows users to review and analyze past market conditions to refine their strategies or learn from historical price movements. Key features of on-demand include:
    • Historical data replay: Users can select specific dates and times and replay the market activity as if it were occurring in real-time.
    • Advanced charting and analysis: Users can apply technical indicators, draw trend lines, and perform analysis on historical data to study patterns and price movements.
    • Strategy evaluation: Traders can test their strategies on historical data, assess their performance, and make adjustments based on past market conditions.
    • Learning and education: On-demand provides an opportunity for traders to review historical events, study market behavior, and enhance their understanding of the markets.

In short, Thinkorswim’s paper trading feature focuses on simulated trading with virtual funds in real-time market conditions, while the on-demand feature allows users to replay historical market data for analysis, strategy refinement, and educational purposes.

Thinkscript

The best part about all of this is that ThinkScript indicators can be used with both Thinkorswim’s paper trading and on-demand features! ThinkScript is a scripting language developed by TD Ameritrade that allows users to create their own custom studies, strategies, and alerts within the Thinkorswim platform.

When using Thinkorswim’s paper trading feature, you can apply your custom ThinkScript indicators to analyze the simulated market data and test your trading strategies. The platform provides a built-in editor where you can write and modify ThinkScript code, and then apply those custom indicators to your paper trading charts.

By utilizing custom ThinkScript indicators while paper trading, you can enhance your analysis, identify potential trade setups, and evaluate the effectiveness of your trading strategies in a simulated environment. This can help you gain confidence in your custom indicators and refine them before using them in live trading with real money.

1. Real-time market data is available only with a funded account, and you must sign the exchange agreements first. Additionally, to remove the delay from your PaperMoney account you’ll need to contact TD Ameritrade support directly either through phone support or by chat.

Double bottom line investing

Double bottom line investing, also referred to as “impact investing” or “socially responsible investing,” refers to a type of investment strategy that seeks both financial returns and social or environmental impact. This approach aims to create a positive impact on society or the environment while also generating profits for investors.

Unlike traditional investment approaches that focus solely on financial returns, double bottom line investors consider social and environmental factors in their investment decisions. This could include investing in companies that are working to solve social or environmental issues, such as those focused on renewable energy or sustainable agriculture. By investing in companies with a strong commitment to social and environmental responsibility, double bottom line investors aim to create a positive impact on society while still generating financial returns.

There are various investment asset classes that can be considered for impact investing, depending on the specific social or environmental goals that an investor wants to achieve. Some examples of asset classes that can be used for impact investing include:

  • Public equities: Investing in publicly traded stocks of companies that have a strong commitment to sustainability and social responsibility.
  • Private equity: Investing in privately held companies that are focused on addressing social or environmental issues, such as renewable energy or clean water.
  • Bonds: Investing in fixed income securities issued by companies or governments that are focused on addressing social or environmental issues.
  • Real estate: Investing in real estate projects that are designed to have a positive impact on the environment or community, such as affordable housing or green buildings.
  • Microfinance: Investing in microfinance institutions or funds that provide financial services to low-income individuals or communities.
  • Impact funds: Investing in mutual funds or exchange-traded funds (ETFs) that are focused on impact investing, and typically invest in a variety of asset classes.

What’s the risk?

Impact investing can involve a higher degree of risk than traditional investing, and investors should carefully evaluate the potential financial and social returns before making any investment decisions. Many impact investments are made in emerging or untested markets, where the regulatory environment and business practices may not be well-established. This can increase the risk of investing in such markets as they may not have a proven track record of success. Some impact investments may not be liquid, meaning they cannot be easily bought or sold on the open market. This can limit an investor’s ability to sell their investment and can increase the risk of not being able to recover their initial investment.

Impact investments are typically made with the goal of achieving social or environmental impact, in addition to financial returns. However, achieving such impact may take time and resources, and there is no guarantee that the desired outcomes will be achieved. This can increase the risk of an investment not meeting its intended impact objectives. Impact investing is a relatively new field, and many impact investment strategies have limited track records of success. This can make it difficult for investors to assess the performance of potential impact investments, and can increase the risk of investing in an unproven strategy.

Aligning personal goals with investment goals

When considering impact investing, you should align your personal goals with your investment goals. Start by identifying personal values and priorities that align with social or environmental impact. For example, you may prioritize sustainability, social justice, or community development. Once personal values and priorities have been identified, set specific impact goals that align with those values. This could include goals such as reducing carbon emissions, supporting fair labor practices, or improving access to education.

Once impact goals have been set, determine investment goals that align with those impacts. For example, you may seek to invest in renewable energy companies, fair trade businesses, or education-focused organizations. Evaluate potential impact investments to determine if they align with your personal and impact goals, and to assess the potential risks and rewards of each investment opportunity. Once impact investments have been made, monitor their performance and impact on an ongoing basis. Adjust investments as needed to ensure they continue to align with your personal and impact goals.

By aligning personal and impact goals with investment goals, you can make meaningful contributions to social and environmental causes while still achieving your financial objectives!

Emotional trading can lead to losses. Tips to greater profitability

The stock market is unpredictable and it’s unpredictable for a variety of reasons. Changes in economic factors such as inflation, interest rates, and gross domestic product (GDP) growth can affect investor sentiment and lead to changes in stock prices. The performance of individual companies can have a significant impact on their stock prices. If a company reports strong earnings or announces a new product, its stock price may rise. Conversely, if a company reports weak earnings or faces legal or regulatory issues, its stock price may fall. Political events such as elections, changes in government policy, or geopolitical tensions can also affect the stock market. These events can create uncertainty among investors and lead to volatility in stock prices. Investor sentiment plays a large role in stock market unpredictability. This, in my opinion, is one of the single most influential factors. If investors are optimistic about the future of the economy and individual companies, stock prices may rise. However, if investors become fearful or uncertain, stock prices may fall.

One truism about making money in any market is that perception overpowers reality. Even during periods of great economic growth, holding on to the stock of fundamentally sound companies may not make you any richer. If investors perceive that better profits can be made elsewhere, that is where the money is going to go.

Stephen Bigalow, Profitable Candlestick Trading (Amazon affiliate link)

I’ve said it before, and I’ll say it again. You need to write a trading plan! In addition, you should attempt to learn the art (or maybe it’s a skill) of trading without emotion. Trading without emotion can help you improve your odds of success in an unpredictable market in several ways. Emotions such as fear, greed, and panic often lead traders to make impulsive decisions that are not based on sound analysis or strategy. By trading without emotion, you can avoid making impulsive decisions and stick to your trading plan. It’s no easy task, and requires discipline and self-control. Traders who are able to control their emotions are more likely to stick to their trading plan and avoid making emotional decisions that can lead to losses. You’ll also be more likely to make more rational decisions based on objective analysis of market data and other factors. This can help you identify trends and patterns in the market and make more informed trading decisions. Emotional trading can also lead to overtrading, which can be costly for traders. By trading without emotion, you can avoid the temptation to make too many trades and focus on making high-quality trades that are more likely to be profitable.

Learning to put emotions aside when trading stocks can be challenging, but here are some tips that can help:

  • Develop a Trading Plan: I know…I said it again, again! Having a well-defined trading plan can help you make more objective trading decisions. This plan should include your trading strategy, risk management guidelines, and criteria for entering and exiting trades. By sticking to your plan, you can avoid making emotional decisions that deviate from your strategy.
  • Use Technical Analysis: Technical analysis involves studying price charts and other market data to identify trends and patterns in the market. By using technical analysis, you can make more objective trading decisions based on market data rather than emotions.
  • Manage Risk: Managing risk is essential for trading without emotion. This involves setting stop-loss orders to limit your potential losses and determining your risk tolerance for each trade. By managing your risk, you can reduce the emotional impact of trading losses.
  • Practice Mindfulness: Mindfulness techniques, such as meditation or deep breathing exercises, can help you stay calm and focused during volatile market conditions. By practicing mindfulness, you can develop a greater awareness of your emotions and learn to manage them more effectively.
  • Learn from Your Mistakes: It’s important to learn from your mistakes and avoid repeating them in the future. Analyzing your past trades and identifying the emotional factors that influenced your decisions can help you improve your trading performance over time.

Trading without emotion takes time, effort, and practice. By developing a trading plan, using technical analysis, managing risk, practicing mindfulness, and learning from your mistakes, you can become a more disciplined and successful trader. As always, I wish you the best and happy trading!

Find other tips, tricks, and content on these other fine social media platforms. Please subscribe/follow to stay informed of the latest content!

The two essentials of trading – Trading edge & trading plan

If you’re just beginning your trading journey, there are two essentials that you absolutely must have before you start. Nobody wants to lose money in the market, but the fact is that every trader will lose money. The difference in a successful trader and a failing trader is that the successful trader knows how to plan the trade and trade the plan. Simply put, they know that their trading edge and trading plan are the key factors in being a successful trader.

What is a trading plan?

A trading plan is a written document that outlines a trader’s strategy and approach to trading. The specific details of a trading plan will vary depending on the trader’s individual style and preferences, but here is an example of what a typical trading plan might include:

  • Trading goals: The trader should clearly define their trading goals, such as the desired rate of return, the amount of capital to be invested, and the time frame for achieving their goals.
  • Market analysis: The trader should conduct a thorough analysis of the market, including an assessment of overall market trends, sector performance, and individual stock performance. This analysis should be based on statistical data and technical analysis.
  • Entry and exit criteria: The trader should establish clear criteria for entering and exiting trades, based on their analysis of market trends and statistical advantage. This could include specific price levels, chart patterns, or other technical indicators.
  • Risk management: The trader should define their risk management strategy, including position sizing, stop-loss orders, and maximum loss limits. This is essential for managing risk and avoiding catastrophic losses.
  • Trading journal: The trader should keep a trading journal to record all trades, including entry and exit points, position sizes, and profits or losses. This can help the trader to analyze their performance and identify areas for improvement.
  • Review and evaluation: The trader should regularly review and evaluate their trading plan and performance, making adjustments as necessary based on changes in market conditions or their own experience.

What does statistical advantage mean, and how might it relate to trading stocks?

A statistical advantage is a probability-based advantage that arises from the analysis of historical data. In the context of trading stocks, a statistical advantage could mean identifying patterns and trends in the historical data of a particular stock or the overall market that could be used to make informed trading decisions. For example, a trader might use technical analysis to identify historical price patterns and support and resistance levels in a particular stock.

By analyzing this data, the trader might identify a statistical advantage in predicting the future price movements of that stock. Another way a statistical advantage might relate to trading stocks is through the use of quantitative models and algorithms. These models use statistical analysis to identify market trends and patterns that could be used to make profitable trades.

When people say trading edge they are referring to a statistical advantage. A trading edge is a statistical or strategic advantage that a trader possesses, which increases their chances of making profitable trades in the stock market. This edge can come from a variety of sources, including a deep understanding of market trends and patterns, access to privileged information, advanced technical analysis skills, or proprietary trading algorithms.

Having a trading edge means that a trader has a higher probability of being right in their market predictions than the average market participant. This can lead to consistently profitable trades and long-term success in the stock market. Having a trading edge does not guarantee profits, but rather it increases the probability of success. To maintain a trading edge, you must constantly adapt and refine their strategies based on changing market conditions and evolving market trends.

Remember the saying, you have to survive until you thrive. The key to doing so is keeping your losers small and your winners big, and the only way to achieve those two things is to plan your trade and trade your plan!

Find other tips, tricks, and content on these other fine social media platforms. Please subscribe/follow to stay informed of the latest content!

Trading using confluence

Trading using confluence is an important aspect of any good trading system. Confluence refers to the coming together of multiple factors that confirm a trading signal or setup, which increases the probability of a successful trade. In intraday trading, where price movements can be quick and unpredictable, it’s important to have multiple confirmations before entering a trade. Confluence should be used for swing, and long-term trading as well.

Some examples of confluence factors in trading include:

  1. Technical indicators: When multiple technical indicators such as moving averages, RSI, and MACD all point to the same direction, it can provide confluence and increase the likelihood of a successful trade. Thinkorswim indicators are available on our site. If you’re using Trading View you might want to read about the top 3 best Trading View indicators.
  2. Support and resistance levels: When price approaches a key support or resistance level, and it coincides with a trend line or a moving average, it can provide confluence for a trade setup.
  3. Fundamental factors: When news or economic data aligns with technical signals, it can provide additional confirmation for a trade.

One of my favorite strategies is the classic pullback strategy, but attempting to take a trade on just one entry signal can be a mistake. In order to increase the likelihood that an entry will result in a winning trade, we must use confluence by looking at a higher timeframe. This is called multiple timeframe analysis.

Trading using confluence is closely related to multiple timeframe analysis. Multiple timeframe analysis involves analyzing price action and trends across multiple timeframes to gain a better understanding of the overall market context and to identify trading opportunities. When using confluence in trading, traders typically look for multiple factors that confirm a trading signal or setup. These factors can include technical indicators, support and resistance levels, and fundamental factors. When multiple factors align and confirm a trade setup, it provides a higher level of confidence in the trade.

Multiple timeframe analysis is important when looking for confluence in trading because it allows traders to identify trends and potential trading opportunities on different timeframes. For example, a trader might identify a bullish trend on the daily chart and then look for confluence on a lower timeframe, such as the 1-hour chart, to enter a long position. By analyzing multiple timeframes, traders can also gain a better understanding of the overall market context and potential price action that may affect their trades. This can help traders manage risk and avoid entering trades that may go against the overall market trend.

Trading using confluence and multiple timeframe analysis go hand in hand. By analyzing multiple timeframes and looking for confluence in trading signals and setups, traders can increase their confidence in their trades and make more informed trading decisions.

Find other tips, tricks, and content on these other fine social media platforms. Please subscribe/follow to stay informed of the latest content!

How is a pullback defined and how do I trade it?

A pullback is a temporary reversal in the direction of an underlying trend. In other words, it is a retracement in price that goes against the current trend. For example, if an asset is in an uptrend and its price starts to fall for a short period before resuming its upward trajectory, that short-term decline is called a pullback. Similarly, if an asset is in a downtrend and its price rises temporarily before resuming its downward trend, that short-term increase is also called a pullback.

Pullbacks can be caused by a variety of factors, such as profit-taking by traders, changes in market sentiment, or unexpected news or events that impact the market. They can be identified by technical analysis tools such as trend lines, moving averages, or chart patterns.

The pullback strategy is a popular one among traders, including day traders. It is a common strategy that is used to take advantage of temporary price retracements within a larger trend. Many traders believe that pullbacks can provide favorable risk-to-reward opportunities because they can offer a chance to enter a trade at a better price than the trend’s current price.

How to trade a pullback

Traders need to identify the direction of the trend to determine whether a pullback is likely to occur. They may use technical analysis tools such as moving averages, trend lines, or chart patterns to identify the trend. Once the trend is identified, traders look for a pullback in price that retraces a portion of the trend’s move. They may use technical indicators such as the Relative Strength Index (RSI) or Moving Average Convergence Divergence (MACD) to confirm the pullback. Day traders look for areas where the price may find support and reverse its direction. They may use previous swing lows, Fibonacci retracement levels, or moving averages as potential support levels.

Traders may wait for confirmation that the pullback is ending and the trend is resuming before entering a trade. They may look for bullish candlestick patterns, a break of a trend line, or a bounce off a support level as confirmation. Once the confirmation is received, traders may enter a long position with a stop loss order just below the support level. They may also set a profit target based on the previous swing high or a Fibonacci extension level.

Traders need to manage their trade by monitoring the price action and adjusting their stop loss and profit target levels as the trade progresses. They may also use trailing stop orders to lock in profits as the price moves in their favor.

What are the Trade For Me rules for trading a pullback?

  1. There must be a sequential series of retracing bars that do not exceed the average range. Our favorite average for intraday trading is 20 periods.
  2. There must be at least two (2) or more lower highs for a long entry, or two (2) or more higher lows for a short entry.
  3. It must be the first or second pullback of a stage 2 uptrend or coming from a double bottom retest.
  4. Long entry: A buy stop limit order is placed with a stop one penny above the high of the lowest pullback bar. The limit is a few pennies higher than the stop. The stop loss is just below the pullback bar. Add padding of a few pennies to the stop loss. The target is your risk (entry price – stop loss) x 2 + entry price.
  5. Short entry: A sell stop limit order is placed with a stop one penny below the low of the highest pullback bar. The limit is a few pennies lower than the stop. The stop loss is just above the pullback bar. Add padding of a few pennies to the stop loss. The target is your risk (entry price – stop loss) x 2 + entry price.

The pullback indicator for thinkorswim (TOS) has an audible alert when the pattern sets up, so you won’t miss an entry. Like everything with trading, there is no perfect system, so it attempts to find only the best patterns so you don’t miss them. It’s important to note, however, that even though a pattern sets up that appears to be just right, if it doesn’t adhere to the rules above, the trade should not be taken. Specifically, we’re talking about rule #3. It’s very difficult, if not impossible, to determine the long term trend programmatically using an indicator. You will have to rely on your ability to assess where the pattern is coming from to be successful.

Find other tips, tricks, and content on these other fine social media platforms. Please subscribe/follow to stay informed of the latest content!