Trading using confluence

Trading using confluence is an important aspect of any good trading system. Confluence refers to the coming together of multiple factors that confirm a trading signal or setup, which increases the probability of a successful trade. In intraday trading, where price movements can be quick and unpredictable, it’s important to have multiple confirmations before entering a trade. Confluence should be used for swing, and long-term trading as well.

Some examples of confluence factors in trading include:

  1. Technical indicators: When multiple technical indicators such as moving averages, RSI, and MACD all point to the same direction, it can provide confluence and increase the likelihood of a successful trade. Thinkorswim indicators are available on our site. If you’re using Trading View you might want to read about the top 3 best Trading View indicators.
  2. Support and resistance levels: When price approaches a key support or resistance level, and it coincides with a trend line or a moving average, it can provide confluence for a trade setup.
  3. Fundamental factors: When news or economic data aligns with technical signals, it can provide additional confirmation for a trade.

One of my favorite strategies is the classic pullback strategy, but attempting to take a trade on just one entry signal can be a mistake. In order to increase the likelihood that an entry will result in a winning trade, we must use confluence by looking at a higher timeframe. This is called multiple timeframe analysis.

Trading using confluence is closely related to multiple timeframe analysis. Multiple timeframe analysis involves analyzing price action and trends across multiple timeframes to gain a better understanding of the overall market context and to identify trading opportunities. When using confluence in trading, traders typically look for multiple factors that confirm a trading signal or setup. These factors can include technical indicators, support and resistance levels, and fundamental factors. When multiple factors align and confirm a trade setup, it provides a higher level of confidence in the trade.

Multiple timeframe analysis is important when looking for confluence in trading because it allows traders to identify trends and potential trading opportunities on different timeframes. For example, a trader might identify a bullish trend on the daily chart and then look for confluence on a lower timeframe, such as the 1-hour chart, to enter a long position. By analyzing multiple timeframes, traders can also gain a better understanding of the overall market context and potential price action that may affect their trades. This can help traders manage risk and avoid entering trades that may go against the overall market trend.
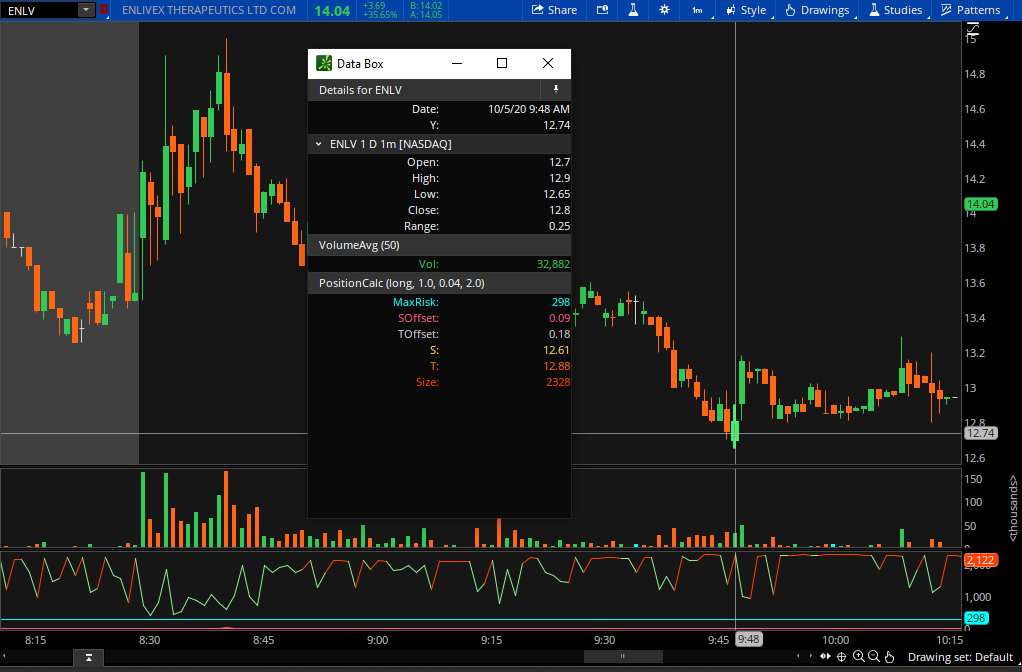
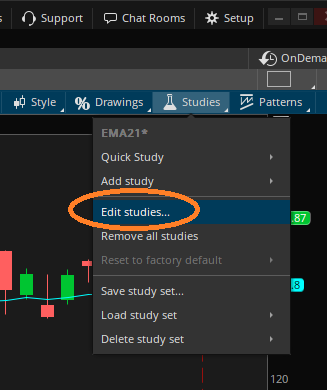
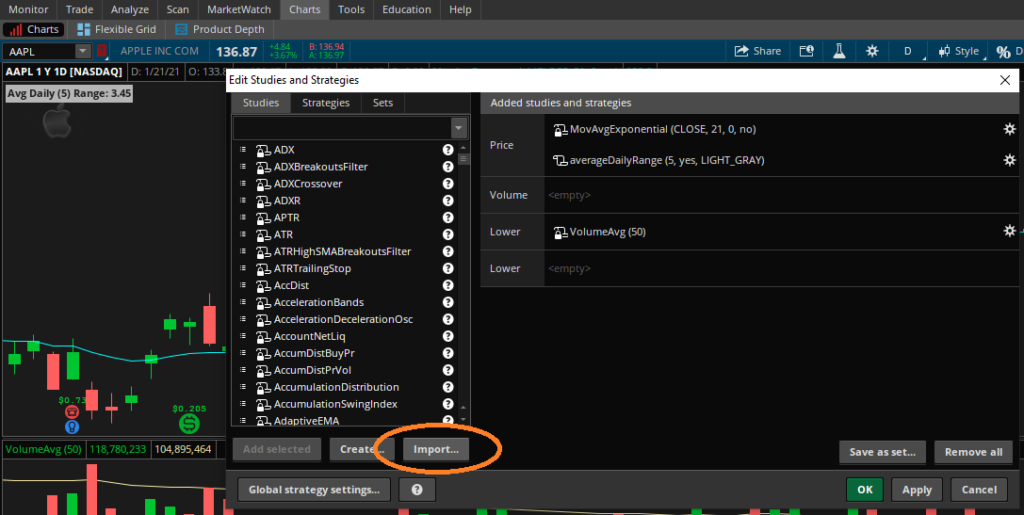
Trading using confluence and multiple timeframe analysis go hand in hand. By analyzing multiple timeframes and looking for confluence in trading signals and setups, traders can increase their confidence in their trades and make more informed trading decisions.

Find other tips, tricks, and content on these other fine social media platforms. Please subscribe/follow to stay informed of the latest content!

How to create a thinkorswim (TOS) dollar gainer scan

If you’re just starting out, be sure to visit the thinkorswim Learning Center first. The video on that page describes how to get started with creating your first scan. I’ll keep this simple, and even provide the code for you! In this scan we will meet the following criteria. 1) The stock must have gained at least one dollar from the previous day’s close during the pre-market trading session. The pre-market is defined as the time between 4:00am and 9:29am. 2) The pre-market cumulative volume must exceed 5,000 shares traded. Here are the steps to create a thinkorswim (TOS) dollar gainer scan. Feel free to update the change and preMktVolMin variables to meet your needs.

  1. For the “Scan in:” section, choose All Stocks from the Category list
  2. For the “Exclude:” section, choose All OTC Stocks from the Category list (unless you like to trade OTC stocks, of course)
  3. Add a filter using the “+ Add filter” button. Choose Stock. Under the first drop-down, choose Last and set the min and max price for the stocks you like to trade
  4. Add another filter. This time choose Study. At the bottom of the first drop-down list, choose custom. A window will open. Click the “thinkScript Editor” tab at the top of the window. Also, change the Aggregation (also at the top of the window) to 1 min. Remove the default code from the editor window and copy/paste the code from below. Update the “change” or “preMktVolMin” variable values as needed.
  5. Add another “Stock” filter. Set it to a Market cap min. of 1M. This will filter out some things that are not stocks.
def change = 1.00;
def preMktVolMin = 50000;
def mktClose = 1559;
def preMktStart = 0400;
def preMktEnd = 0929;
rec closePrice = CompoundValue(1, if SecondsTillTime(mktClose) == 0 then close else closePrice[1], close);
def gainers = (close - closePrice) >= change;
def preMkt = SecondsFromTime(preMktStart) >= 0 and SecondsTillTime(preMktEnd) >= 0;
def preMktVol = if preMkt and !preMkt[1] then volume else if preMkt then preMktVol[1] + volume else preMktVol[1];
plot scan = preMkt and gainers and preMktVol > preMktVolMin;
  1. Click OK to exit the window.
  2. Click the menu to the far right of the “Add condition group” button, and click “Save scan query…”
  3. Give your scan a name, and save it.
  4. Click the Scan button and await your results! NOTE: If you’re not scanning during the pre-market, you’ll get no results.

Find other tips, tricks, and content on these other fine social media platforms. Please subscribe/follow to stay informed of the latest content!

How to view the Position Size Calculator for thinkorswim

Once you’ve installed the Position Size Calculator for thinkorswim you may be asking yourself how to actually view the calculations. Some thinkScripts overlay things on your charts, but this particular script adds calculations to the data box. In this post, I’ll describe how you can enable to floating data box so you may easily view the position size calculations. Before you proceed, be sure that the indicator is installed in one of the “lower” positons of the edit studies area. Placing it on the “Price” or “Volume” area will smush the candles on the chart.

Data Box is a tool that displays values from the status string on chart. Once enabled, Data Box displays OHLC and study values for the bar under the cursor. As you move the cursor across the chart, values change in the same manner as in the status string.

In order to enable Data Box, choose Settings from the Style menu and activate Data Box item on the General tab. Choose Floating to make the Data Box follow the cursor or Fixed to display it as a separate element. Choose Off so that the Data Box will not be shown. You can also turn off the status string since the values are displayed in Data Box.

If you chose to use the Fixed mode, Data Box will appear as a separate element: you can move it to whichever position you prefer. This mode will also restore this position if you restart the application. There is also an option to display it above all opened windows so that it will be visible even if you minimize the application window; in order to do so, click the Pin button at the top of the Data box. Note that if you use a grid of charts, Fixed mode will show values for the chart under cursor.

In the Floating mode, Data Box will follow the cursor, so, the list of displayed values is not customizable. Consider using the Synchronize crosshairs position option on General tab of Chart settings in order to display separate Data Boxes for each chart in a grid. Note that in the Floating mode, Data Box will be hidden if the size of chart window is not sufficient to display it.

TD Ameritrade Learning Center

I have to say, I’m a big fan of the floating mode. It allows me to place the data box on another screen so it doesn’t interfere with my charts and other account information that I like to leave up. Also, when it’s in fixed mode, there’s very little data you can actually see if you’re screen isn’t super wide, so for me it’s practically useless in that mode.

Find other tips, tricks, and content on these other fine social media platforms. Please subscribe/follow to stay informed of the latest content!

How to create a TD Ameritrade API key for automated trading

If you’re planning on developing an app to automate your favorite trading strategies, or you’ve gotten your hands on a copy of Trade For Me and you’re just getting started, you will need to create a TD Ameritrade Developer account and register an application to get an API key (consumer key). In this article you will learn step-by-step how to complete your account set up.

Step One: Register

TD Ameritrade Developer register

In your browser, navigate to developer.tdameritrade.com and click the “Register” link at the top of the page. When prompted to choose a username, ignore the rules provided (special characters, spaces, etc.). They are inconsistent. The best choice for your username will be letters only with no spaces or special characters.

Step Two: Activate your account

TD Ameritrade Developer email

After completing the registration form, you will receive an email with a link to activate your account.

Step Three: Create a profile

TD Ameritrade Developer profile page

Fill in your profile details. In this step you will create a password, add your first and last name, add your address, choose a timezone, and accept the terms and conditions.

Step Four: Add an app

TD Ameritrade Developer add app screen

Click “Add a new App”

TD Ameritrade Developer App Details Screen
  • Give your app a name
  • Enter a callback URL. The callback URL will be the URL to which you are redirected after successful authentication. If you are using Trade For Me, this is the app URL on your local network, and after authentication, you’ll be redirected to the app and the access and refresh tokens will be saved in your local database.
  • Describe the purpose of your app
  • Enter an order limit

Step Five: Copy your API Key

TD Ameritrade Developer API Key

After creating the app, you will be able to open it and retrieve your API Key (Consumer Key).

Congratulations! You have completed your app configuration in the TD Ameritrade Developer website. Now it’s on to the next step. Making money!

Find other tips, tricks, and content on these other fine social media platforms. Please subscribe/follow to stay informed of the latest content!

How to install thinkorswim (TOS) studies

thinkorswim study installation steps

Installing the studies into your thinkorswim platform takes only a few moments. After purchase, you will be provided a download link. The downloaded file will be in a .zip archive format and you will need to extract the contents of the .zip file before installation. On a mac, simply double-click the zip archive to extract it into a folder with the same name as the .zip. On a Windows computer, right-click and choose “Extract All” from the context menu. You will be provided with an option where you would like to save the extracted files.

1. Select studies menu, then edit studies

thinkorswim edit studies

2. Choose the import option

thinkorswim import

3. Navigate to and choose the name_of_script_here_STUDY.ts file from the .zip archive

thinkorswim (tos) navigate

4. Rejoice! You’ve successfully installed the thinkorswim (tos) study into your platform!

Find other tips, tricks, and content on these other fine social media platforms. Please subscribe/follow to stay informed of the latest content!