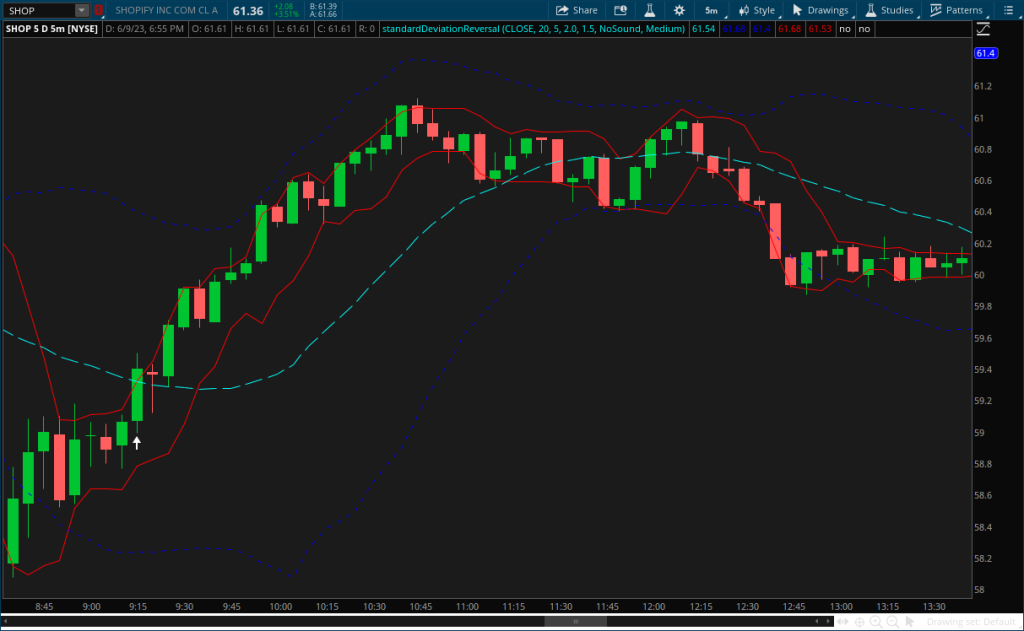
Successful trading is a delicate balance of skill, strategy, and timing. One of the key elements in achieving profitability in the market is mastering the art of entering and exiting positions at the right time. thinkorswim, a powerful trading platform by TD Ameritrade (now the platform is owned by Charles Schwab), provides traders with a comprehensive suite of indicators that can significantly enhance decision-making processes. In this blog post, we’ll explore how thinkorswim indicators can be invaluable tools for traders aiming to optimize their entry and exit points.
Understanding Market Trends
Before executing any trade, it’s crucial to identify the prevailing market trend. thinkorswim offers a variety of trend indicators such as Moving Averages, Bollinger Bands, and the Average True Range (ATR). These indicators help traders analyze the direction and strength of the market, aiding them in making informed decisions on when to enter or exit a position.
- Moving Averages (MA): Moving averages, available in various forms (simple, exponential, weighted), smooth out price data to create a trend-following indicator. Traders use MAs to identify the direction of the trend. Crossovers between short-term and long-term MAs can signal potential trend reversals or continuations.
- Bollinger Bands: These consist of a middle band being an MA and two outer bands representing standard deviations. Bollinger Bands help traders identify overbought or oversold conditions and potential price reversals when the price touches or exceeds the outer bands.
- Average True Range (ATR): ATR measures market volatility, providing insights into potential price movements. Traders can use ATR to set stop-loss and take-profit levels based on the current market conditions.
Timing Entry Points
The Relative Strength Index (RSI) and the Moving Average Convergence Divergence (MACD) are powerful tools for timing entry points. RSI indicates overbought or oversold conditions, signaling potential reversal points. MACD, on the other hand, provides insights into the momentum of a trend, helping traders identify optimal entry opportunities.
- Relative Strength Index (RSI): RSI measures the speed and change of price movements. An RSI above 70 suggests overbought conditions, indicating a potential reversal, while an RSI below 30 suggests oversold conditions, signaling a possible buying opportunity.
- Moving Average Convergence Divergence (MACD): MACD consists of two lines – the MACD line and the signal line. Crossovers between these lines provide buy or sell signals. Additionally, MACD histogram bars indicate the strength of the trend.
Setting Stop-Loss and Take-Profit Levels
Managing risk is a crucial aspect of successful trading. thinkorswim’s ATR indicator can be immensely helpful in setting appropriate stop-loss and take-profit levels. By understanding the average volatility of a security, traders can establish realistic expectations and mitigate potential losses by placing stops at strategic levels.
ATR can help traders set dynamic stop-loss levels by considering the current volatility. For example, a trader may set a stop-loss at 1.5 times the ATR below the entry price to account for potential market fluctuations.
Utilizing Custom Scripts
One of the standout features of thinkorswim is its ability to create and implement custom scripts. Traders can develop personalized indicators and strategies based on their unique preferences and trading styles. Whether it’s a custom moving average crossover strategy or a unique combination of technical indicators, the platform allows for endless possibilities in optimizing entry and exit signals.
thinkorswim’s thinkScript language allows traders to create custom indicators and strategies. Traders can develop scripts to generate personalized signals based on unique technical analysis criteria. This customization ensures that indicators align with individual trading styles and preferences.
Backtesting and Analyzing Strategies
Before implementing any strategy, it’s essential to backtest and analyze its historical performance. thinkorswim provides a robust backtesting feature that allows traders to simulate their strategies on historical data. This invaluable tool enables traders to assess the effectiveness of their entry and exit signals under various market conditions, helping refine and optimize their approach.
thinkorswim’s Strategy Roller feature enables traders to backtest their strategies on historical data. This allows for a thorough analysis of how a particular strategy would have performed in past market conditions. Traders can identify strengths and weaknesses, refine parameters, and optimize their strategies for better performance.

Thinkorswim
Mastering the skill of entering and exiting positions is a continuous journey. thinkorswim, with its array of sophisticated indicators and analytical tools, empowers traders to make well-informed decisions. By leveraging these indicators, traders can enhance their ability to identify trends, time entries and exits, and manage risk effectively. As with any trading strategy, it’s crucial to combine technical analysis with a solid understanding of market fundamentals and risk management. With thinkorswim’s comprehensive toolkit, traders have the resources they need to navigate the markets with confidence and precision. Happy 2024!
