Description
This package includes watchlist column code. To add the custom column:
- Click Gear -> Click Customize
- Search ‘custom’ and click the script icon for one of the options.
- Delete the default study/condition.
- Click ‘thinkScript Editor’ tab.
- Add a name of your choosing -> paste in the script -> click ‘Apply’ and ‘OK’
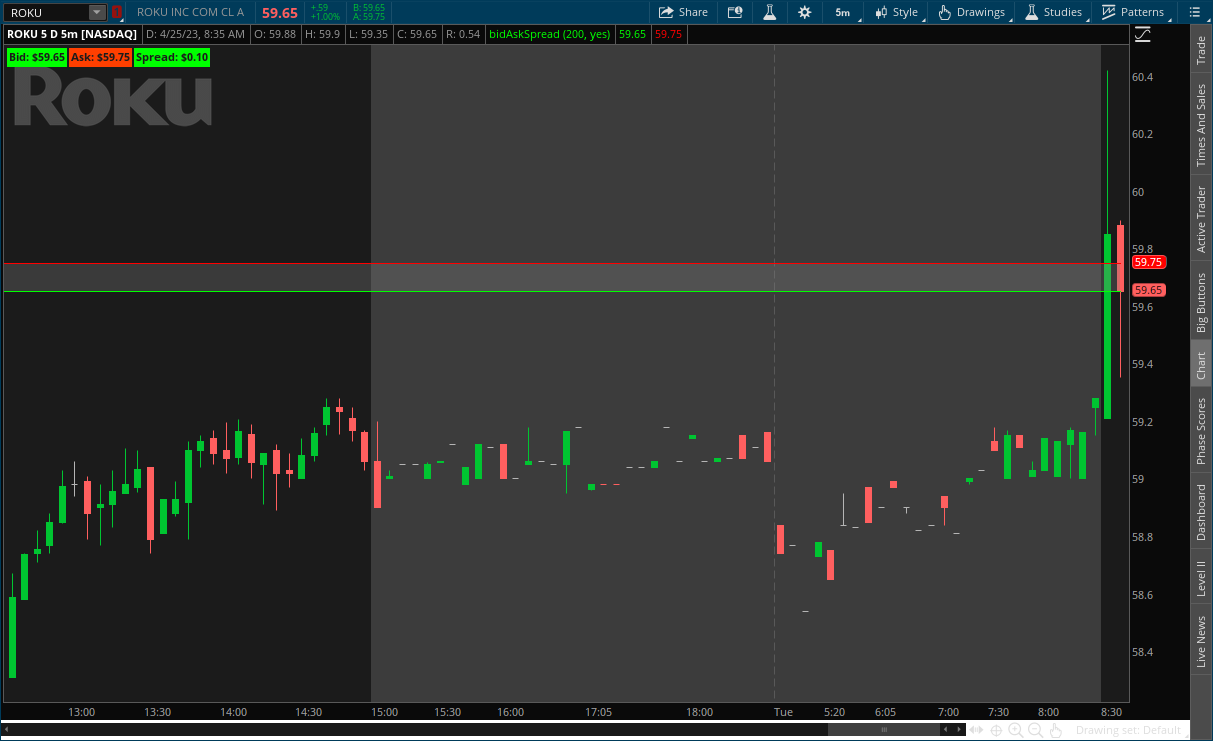
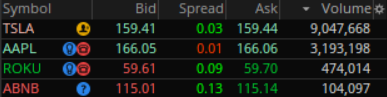
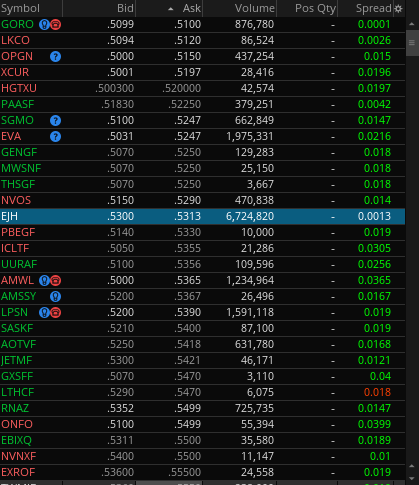
When the last price is greater than or equal to the bid, the label color is green. If less than the bid, it’s red. This logic applies to the column text color as well.
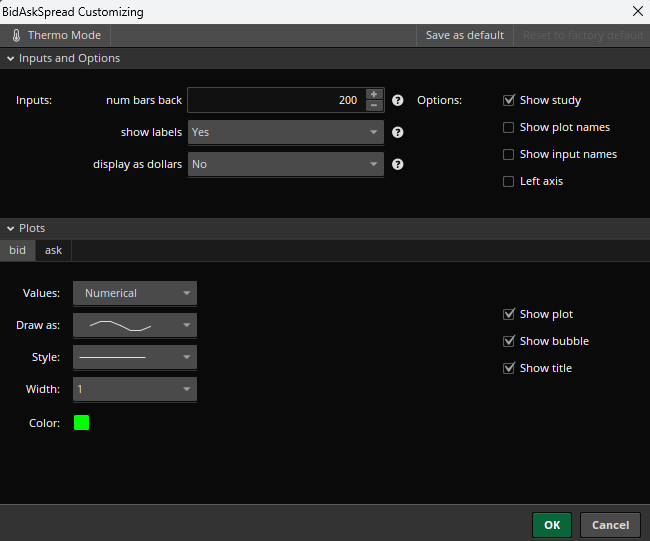
Customizable options for this indicator include:
- num bars back: default 200
- Determines how far back the lines should be drawn on your chart.
- show labels: default yes
- Enable or disable the optional bid, ask, and spread labels.
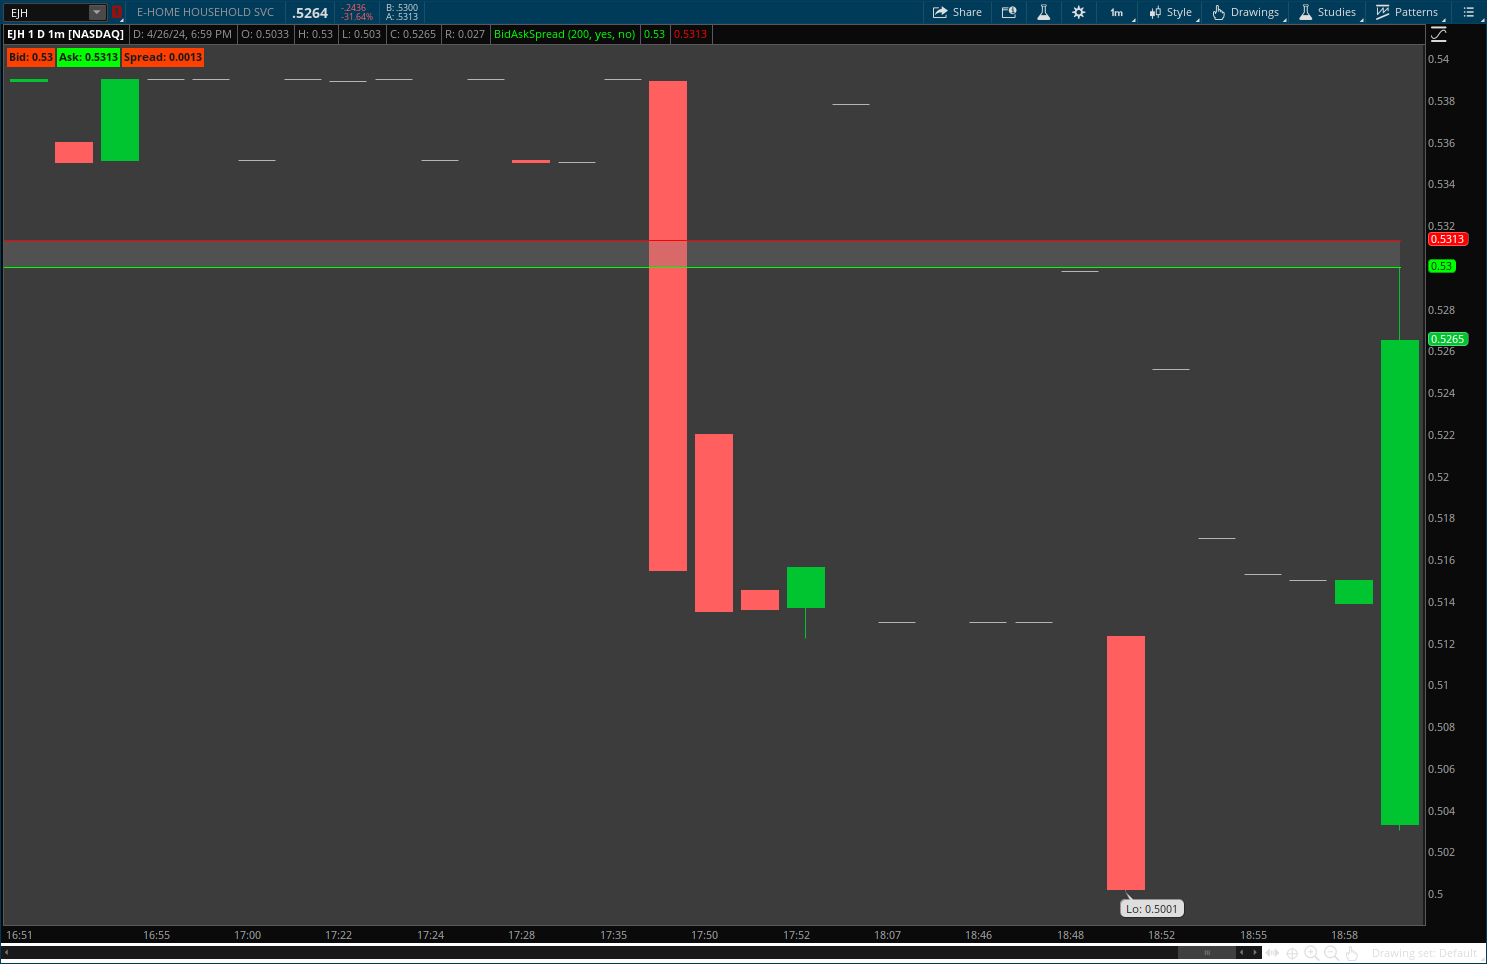
- display as dollars
- Display bid, ask, and spread as whole dollars in label, if show labels is set to yes. Set to no to disable rounding for trading currencies, penny stocks, etc.
DISCLAIMER: WE ARE NOT CERTIFIED FINANCIAL ADVISORS AND NOTHING IN THIS WEBSITE IS AN ADVERTISEMENT OR RECOMMENDATION TO BUY OR SELL ANY FINANCIAL INSTRUMENT, AND NEITHER ARE ANY OF THE PRODUCTS OR CONTENTS OF THIS SITE OR OUR SOCIAL MEDIA CHANNELS INTENDED TO INSTRUCT YOU ON HOW TO MAKE TRADING OR INVESTING DECISIONS. We provide custom thinkScripts and tutorials to help people use the ThinkOrSwim trading platform from TD Ameritrade. TD Ameritrade provides financial services including the trading of Stocks, Futures, Options and Forex, and this website is not affiliated with them in any way. None of our products are endorsed by TD Ameritrade or any of its affiliates. Due to the nature of our products being software, our policy is that all sales are final and there are no refunds or exchanges. That being said, we stand behind our work, and we will try to make sure our customers are happy any way we can. The information contained on this website is solely for educational purposes, and does not constitute investment advice. The risk of trading in securities markets can be substantial. You must review and agree to our terms & conditions of use, disclaimers & privacy policy before using this site.
U.S. Government Required Disclaimer – Commodity Futures Trading Commission. Futures and options trading has large potential rewards, but also large potential risk. You must be aware of the risks and be willing to accept them in order to invest in the futures and options markets. Don’t trade with money you can’t afford to lose. This website is neither a solicitation nor an offer to Buy/Sell futures or options. No representation is being made that any account will or is likely to achieve profits or losses similar to those discussed on this website. The past performance of any trading system or methodology is not necessarily indicative of future results
CFTC RULE 4.41 – HYPOTHETICAL OR SIMULATED PERFORMANCE RESULTS HAVE CERTAIN LIMITATIONS. UNLIKE AN ACTUAL PERFORMANCE RECORD, SIMULATED RESULTS DO NOT REPRESENT ACTUAL TRADING. ALSO, SINCE THE TRADES HAVE NOT BEEN EXECUTED, THE RESULTS MAY HAVE UNDER-OR-OVER COMPENSATED FOR THE IMPACT, IF ANY, OF CERTAIN MARKET FACTORS, SUCH AS LACK OF LIQUIDITY, SIMULATED TRADING PROGRAMS IN GENERAL ARE ALSO SUBJECT TO THE FACT THAT THEY ARE DESIGNED WITH THE BENEFIT OF HINDSIGHT. NO REPRESENTATION IS BEING MADE THAT ANY ACCOUNT WILL OR IS LIKELY TO ACHIEVE PROFIT OR LOSSES SIMILAR TO THOSE SHOWN.